Mapping the Student Experience
11/16/18 Multiple Subject Program Meeting
Improvement-Implementation Science
- User-centered
- Measurable
- Inquiry driven improvement
- Networked Improvement
- Communities
Journey Maps: What & Why
- A journey map is a visualization of a person’s particular experience.
- Journey maps help provide insight in understanding successes and challenges in a program, which lead to opportunities for improvement.
- Practice: Candidate & Faculty Reflection
- Research: Understand student experience across preparation model types
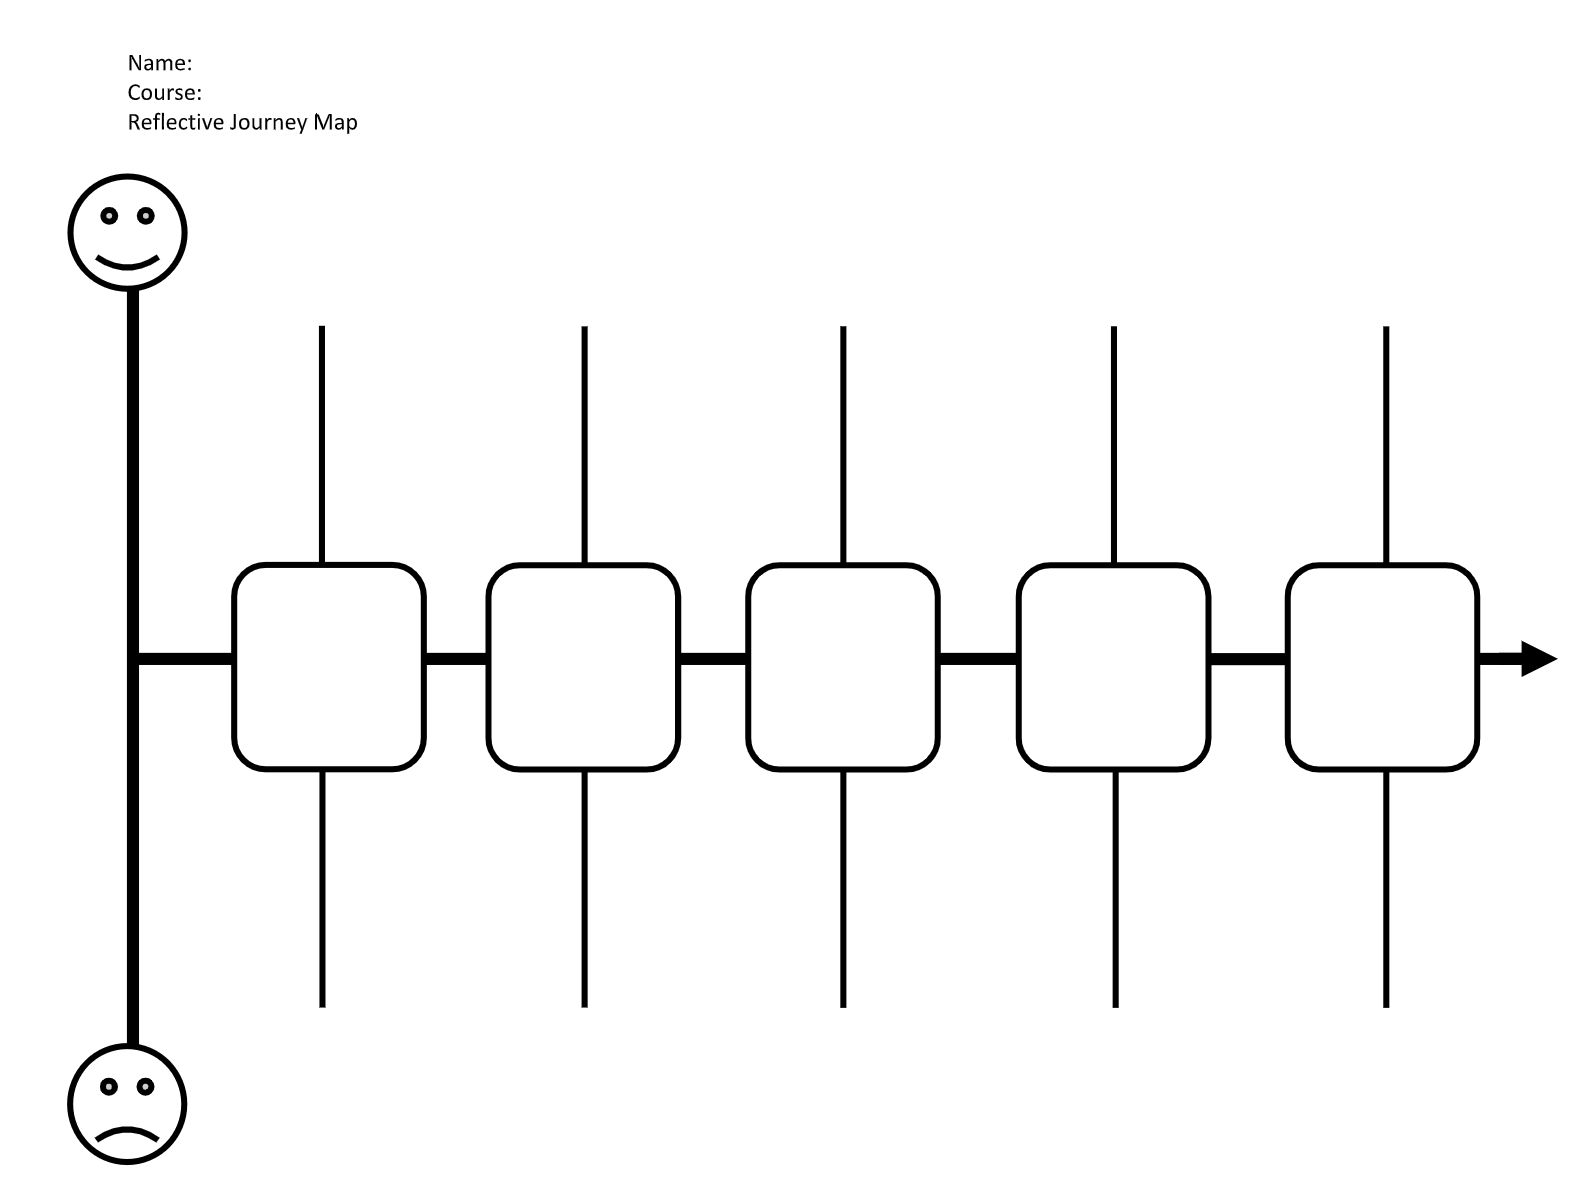
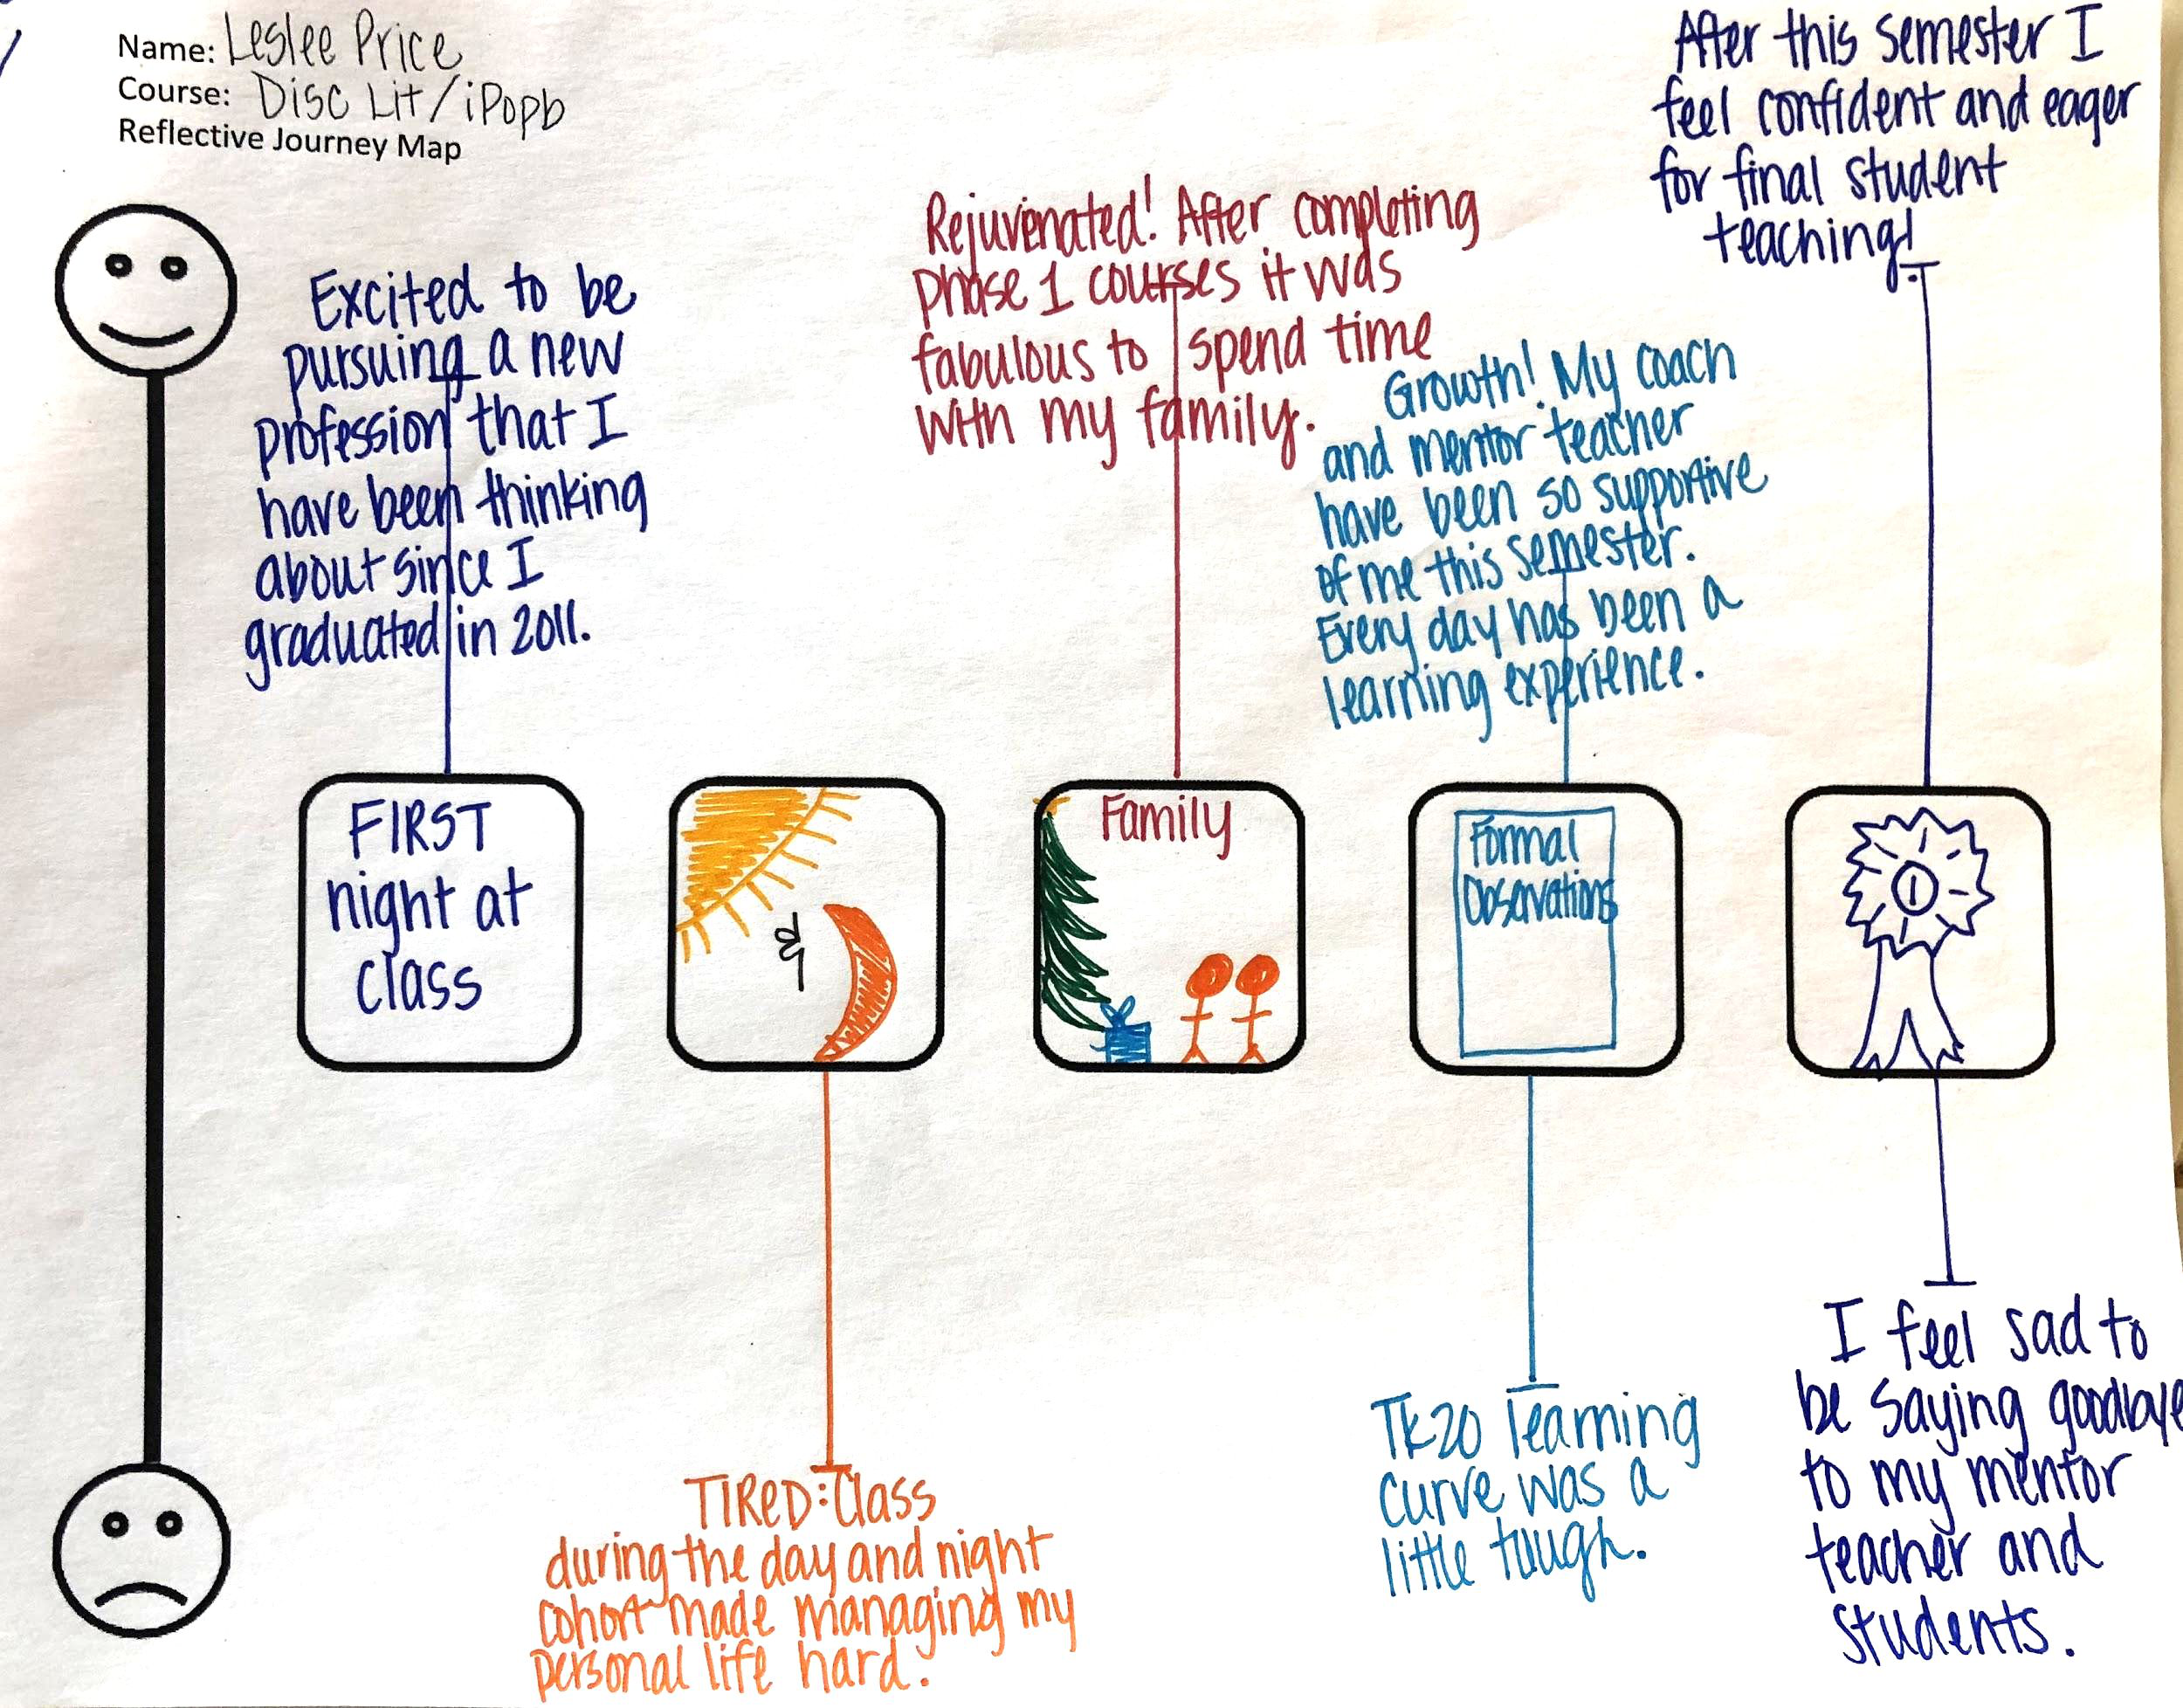 Initial Guiding Questions
- Which experiences did students perceive as milestones of the multiple subject program?
- How did the students feel about the experiences that they perceived as milestones of the multiple subject program?
What stands out to you?
Data Overview
| When | Model | District | N |
|---|---|---|---|
| Spring 2018 | Cohort | Fowler | 9 |
| Spring 2018 | Cohort | Clovis | 21 |
| Spring 2018 | Residency | Sanger | 18 |
| Spring 2018 | Residency | Fresno | 26 |
| Spring 2018 | Evening | 88 | |
| Total | 162 |
Codes
| Program | Credential Requirements | Placements | Life Events |
|---|---|---|---|
| Application (n78) | CSET (n47) | Mentor Teachers (n68) | Trauma (n66) |
| Coursework (n81) | RICA Preparation (n12) | Student Teaching (n45) | Employment (n31) |
| Coaches (n34) | SVP (n34) | Interactions with Children (n29) | |
| FS Faculty (n46) | FAST | ||
| Peers (n43) | CBEST | ||
| Communication (n28) |
Which experiences did students perceive as milestones?
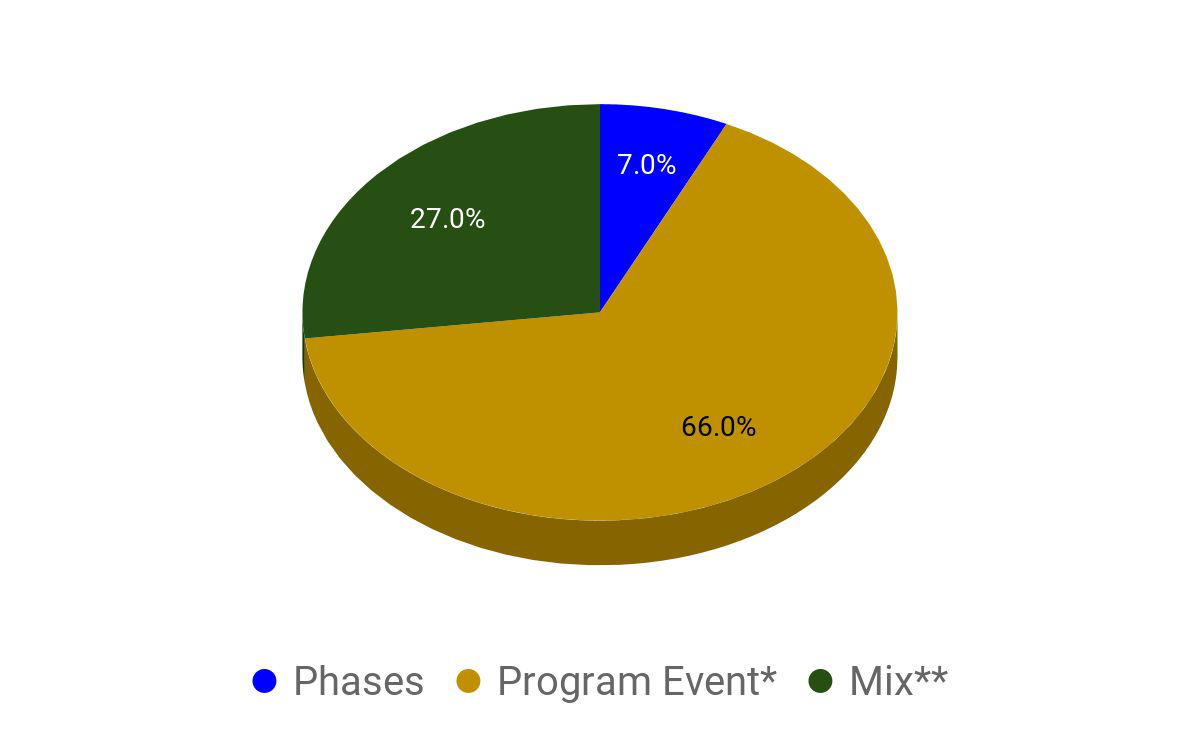
*Program Event:
- FAST
- Credential Exam
- Coursework
- Placement
- Student Teaching
**Mix:
- Phases
- Learning Event
- Life Event
How did the students feel about the experiences that they perceived as milestones of the multiple subject program?
Positive
Most Positive:
- SVP (n34; 97%)
- Student Teaching (n45; 93%)
Also Positive:
- Application process (n78; 78%)
- Placements (n56; 75%)
- Mentor teachers (n68; 74%)
Negative
Most Negative:
- Coursework (n81; 59%)
- Program communication (n28; 96%)
Also Negative:
- Traumatic events (n66; 66%)
A 1, 2, 4 Whole Data Dive...
- Independent work: Take a few minutes to scan the data.
- Pair work: What did you notice?
- Team work: What else would you like to know?
Whole group work: What are the implications of the emerging themes from this analysis for our program and practice?
Student Life Events & Trauma
“It was very stressful for me to have found out we needed to take and pass the CSETs in a short amount of time in order to get into the credential program. I had mental breakdowns.” (Evening, Phase 2)
“Foreclosure. Child failing in school.” (Residency, Phase 1)
“My class was so poorly behaved that there were many days that I went home and cried because I felt like a failure.” (Evening, Phase 2)
“Being broke all the time because you don't have time to work and only having $10 for weeks at a time. Being denied food stamps.” (Evening, Phase 2)
“President Trump terminated DACA. My work permit is about to expire and the notice was given in August. “Mr Trump, you cut my wings and filled my heart with fear. Fear, because in an instant everything I have worked so hard for could be taken away.” (iPoP/Disc).”
Next Steps
- Data analysis across phases and model types.
- Data available for review and discussion.
- Invitation: Collaboration on current and/or future research.
This HTML version was generated with AI assistance and may contain errors or omissions. The original approved PDF remains the official document of record. An alternative accessible format is available upon request from the document creator in accordance with Title II of the ADA.