AAQEP Accreditation
Standard 1 Aspect C
Standard 1c: Evidence shows that, by the time of program completion, candidates exhibit knowledge, skills, and abilities of professional educators appropriate to their target credential or degree, including:
Culturally responsive practice, including intersectionality of race, ethnicity, class, gender identity and expression, sexual identity, and the impact of language acquisition and literacy development on learning
Case for Standard 1c
For this aspect, the SPED program used two data sources: the CSU Year One Teacher
Survey and Midterm and Final Fieldwork Evaluations
Data Sources & Analysis
Data Source 1
CSU Educator Quality Center Year-One Teacher Survey
Description of Data Source:
For candidates who completed a CSU educator preparation program each academic year
from 2014-2015 to 2017-2018, the CSU Educator Quality Center administered a year-out
survey to learn how well the educators, after their first year in the field, believed
the program had prepared them. Year One Teachers respond to each item on a 1-5 scale,
where 1 indicates they were not at all prepared, 2 indicates they were poorly prepared;
3 indicates they were adequately prepared; 4 indicates they were well prepared and
5 indicates they were very well prepared.
Due to the challenges of educators in Spring 2020, the CSU Educator Quality chose not to administer the survey at that time, meaning data are not available for candidates who completed in 2018-2019. Survey administration began again in Spring 2021, and we look forward to analyzing those data when they become available.
Perspective Captured from Data Source: Year One Teacher
Rationale for using Data Source:
The CSU Educator Quality Center survey captures the perspectives of program completers
after their first year of teaching. Items on the survey invite candidates to share
how well they believe the program prepared them in several key areas. We specifically
looked at two items in one domain: “Meeting the Needs of All Students.”
Specific Elements of Data Source:
Item selected from the Year One Teacher Survey include:
- Element 1: Preparation of Teachers for Equity and Diversity in Teaching
- Element 2: Preparation of Teachers to Teach English Learners
Definition of Success for Each Element:
Programmatically, our goal is to have our completer average within .2 of the CSU average.
A more long term goal would be to have our average at 3.5 or above.
Displays of Analyzed Data:
Table 1, CSU Year One Completer Survey, 2015-18
| Fresno State | CSU | ||||||
|---|---|---|---|---|---|---|---|
| 15-16 n=12 |
16-17 n=6 |
17-18 n=16 |
Overall n=34 |
15-16 n=254 |
16-17 n=154 |
17-18 n=146 |
Overall n=554 |
| Element 1: Preparation of Teachers for Equity and Diversity in Teaching | |||||||
| 2.53 | 3.12 | 2.24 | 2.5 | 2.96 | 2.79 | 2.76 | 2.84 |
| Element 2: Preparation of Teachers to Teach English Learners | |||||||
| 2.37 | 2.89 | 1.99 | 2.28 | 2.75 | 2.56 | 2.54 | 2.62 |
Link to Full Dataset:
The link to the full dataset is unavailable. However, if reviewers would like to view
the CSU Educator Quality Center Data Dashboards, we are happy to set up a time to
provide them access by sharing screens in a Zoom session.
Interpretation of Data:
Using this data as baseline data illustrates that our program needed to make huge
strides in its preparation of teachers who reflect our program’s commitment to equity
and diversity and to culturally and linguistically sustaining practices. Not only
were we well below the CSU average in 2015-18, but we also were far from reaching
our goal of an overall average of 3.5. The data that follows allows us to reflect
on our growth over the last three years.
Data Source 2
Midterm and Final Fieldwork Evaluations
Description of Data Source:
Candidates in the Education Specialist Program receive a formal evaluation during
both their initial and final student teaching. For this data source, the program
purposely chose to report the results of the evaluations from both the midway and
final stages of three cycles (i.e., semesters) of student teaching. The University
Coaches rate candidates on a scale of 1-4 with 1 as “Does not meet Expectations” and
4 as “Exceeds Expectations.”
Perspective Captured from Data Source: University Coach
Rationale for using Data Source:
The midterm and final field work evaluation are used by our clinical practice/fieldwork
coaches to provide observational feedback to student teachers at both the midway and
final stages of three cycles (i.e., semesters) of student teaching. We used these
evaluations to measure our candidates’ progress in support of culturally and linguistically
sustaining practices including student intersectionality and the impact of language
acquisition and literacy development.
Specific Elements of Data Source:
Coaches’ scores of candidates on the following items at both the midterm and final
stages of candidates’ student teaching:
- Item 2: Inclusive Learning Environment
- Item 9: Research Based Instruction for Emergent Bilinguals
- Item 12: Adapt subject matter curriculum, organization, and planning to support the acquisition and use of academic language within learning activities to promote the subject matter knowledge of all students, including the full range of English learners, Standard English learners, students with disabilities, and students with other learning needs in the least restrictive environment.
Definition of Success for Each Element:
It is the goal of the special education program to prepare all candidates to demonstrate
culturally and linguistically sustaining pedagogy within their student teaching placements.
To measure growth on each item scale, we examined the increase/decrease in scores
from the midpoint to the final evaluation for each semester (i.e., both initial student
teaching and final student teaching semesters).
Displays of Analyzed Data:
Figure 1, Midterm and Final Fieldwork Rubric, Item 2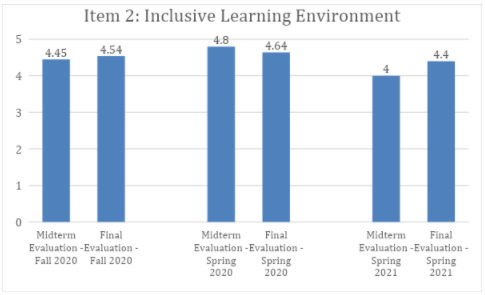
Figure 2, Midterm and Final Fieldwork Rubric, Item 9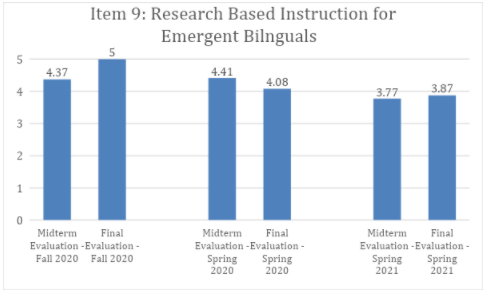
Figure 3, Midterm and Final Fieldwork Rubric, Item 12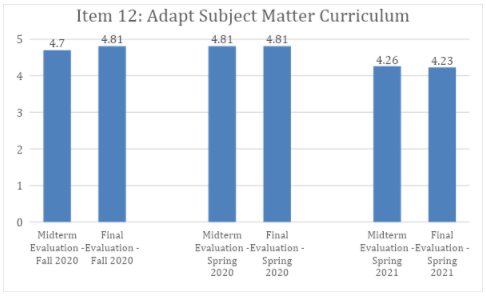
Link to Full Dataset: 2019-2021 Midterm and Final Evaluations Dataset
Interpretation of Data:
Although ultimately it is our aim for every candidate to demonstrate the highest (5
out of 5) scores on coaching evaluations, it is notable that candidate scores over
these three semesters (cycles) show general overall improvements between the mid and
final evaluation. Although growth during the Spring 2020 semester was not improved
from mid to final evaluation, average assessment scores at the midpoint were relatively
high (item 2 = 4.8, item 9 = 4.41, item 12 = 4.81). It is our goal to continue to
measure these areas of growth and to see improvement from mid to final evaluation
points.
Data Source 3
CSU Education Quality Center Program Completer Survey
Description of Data Source:
Each year, the CSU Educator Quality Center administers a survey to program completers
to learn their perceptions of how well the program prepared them in a number of areas
aligned with the California Commission on Teacher Credentialing’s Teaching Performance
Expectations (TPE). Program completers from all CSU campuses are invited to respond
to each item on a 1-5 scale, where 1 indicates they believed that they were “not at
all” prepared and 5 indicates they believe they were “very well” prepared.” Fresno
State has a high rate of completion due to the efforts of our credential analyst who
requires completion as part of the credential application process.
Perspective Captured from Data Source: Program Completers
Rationale for using Data Source:
CSU Educator Quality Center Completer Survey captures program completers’ anonymous
perspectives of how well the program prepared them at the conclusion of their teaching
credential coursework and field experiences, providing valuable insights into their
perceptions of the program.
Specific Elements of Data Source:
Candidate responses for: How well did your program prepare you:
- To engage in culturally responsive teaching
- To meet the instructional needs of English Learners
- To use the California English Language Development Standards to guide instruction of English Learners
Definition of Success: Our definition of success:
- 0% reporting in the “Not at all Prepared” category
- 10% or less in the “Poorly Prepared” category
- Overall positive ratings 90% or higher
We chose to analyze aggregate data from the past four cohorts of candidates, as well as disaggregated data from each cohort in order to determine if there were any trends in responses.
Displays of Analyzed Data:
Table 2, CSU Completer Survey, Element 1, 2018-21
| Element 1: To engage in culturally responsive teaching | |||
|---|---|---|---|
| Year | 2018-2019 N=62 |
2019-2020 N=51 |
2020-2021 N=48 |
| Not at all | 0% | 0% | 0% |
| Poorly Prepared | 3.2% | 2% | 0% |
| Adequately Prepared | 25.8% | 25.5% | 18.8% |
| Well Prepared | 45.2% | 47.1% | 45.8% |
| Very Well Prepared | 25.8% | 25.5% | 35.4% |
| Overall Negative | 3% | 2% | 0% |
| Overall Positive | 97% | 98% | 98% |
Table 3, CSU Completer Survey, Element 2, 2018-21
| Element 2: To meet the instructional needs of English Learners | |||
|---|---|---|---|
| Year | 2018-2019 N=62 |
2019-2020 N=51 |
2020-2021 N=48 |
| Not at all | 1.7% | 0% | 2.1% |
| Poorly Prepared | 3.3% | 3.8% | 0% |
| Adequately Prepared | 36.7% | 36.5% | 25.5% |
| Well Prepared | 36.7% | 36.5% | 25.5% |
| Very Well Prepared | 36.7% | 46.2% | 48.9% |
| Overall Negative | 5% | 4% | 2% |
| Overall Positive | 95% | 96% | 98% |
Table 4, CSU Completer Survey, Element 3, 2018-21
| Element 3: To use the California English Language Development Standards to guide instruction of English Learners | |||
|---|---|---|---|
| Year | 2018-2019 N=62 |
2019-2020 N=51 |
2020-2021 N=48 |
| Not at all | 0% | 0% | 0% |
| Poorly Prepared | 8.3% | 2% | 2.1% |
| Adequately Prepared | 28.3% | 35.3% | 27.1% |
| Well Prepared | 35% | 41.2% | 35.40% |
| Very Well Prepared | 28.3% | 21.6% | 35.4% |
| Overall Negative | 8% | 2% | 2% |
| Overall Positive | 92% | 98% | 98% |
Link to Data Sources: CSU Educator Quality Center Completer Survey
Interpretation of Data:
We met our goal on 2 of the 3 measures for success. The data show that our work in
preparing teachers who address the needs of diverse learners is improving. 81% of
completers last year felt that they were prepared well to “engage in culturally responsive
teaching.” That represents 10% growth in this area over the last 3 years. However,
the data reveal we have not yet reached our goal of no completers who rate themselves
as not prepared in the area of working with English learners. This is especially
concerning because we are in an area with a large population of students who are emergent
bilinguals.
Although we have not yet reached our goal on any of these measures, Still, the data reveal two concerns: 1) completers’ low scores in the area of working with English learners and implementing the California English Language Development Standards to guide instruction of English Learners 2) Moreover, although the percentages are decreasing, there is still a small percentage of completers who rate themselves as “not at all prepared” or “poorly prepared” in these same areas.
Next Steps Narrative:
It is evident from the analyzed data presented in the coaches evaluations that there
is room for continued improvement, although midterm scores are already promising.
It would be more informative to assess initial evaluation scores at the beginning
of the semester to establish baseline score data. Overall, this data indicates that
student teachers (candidates) are acquiring necessary skills to incorporate cultural
and linguistically sustaining practices into their future classrooms (see item 2,
item, 9, item 12).
The opportunity for exposure to diverse learners is particularly prevalent within our geographical setting as our student population who identify as English Language Learners as well as ethnically diverse is considerably higher than the national average. However, as Data Source Three reveals, there is room for a great deal of improvement for our program’s preparation of teachers who are competent and knowledgeable in working with emergent bilinguals. Since we are in the process of redesigning our program, this will be a focus as we consider program requirements and coursework.