AAQEP Accreditation
Standard 1: Aspect A
Standard 1a: Evidence shows that, by the time of program completion, candidates exhibit knowledge, skills, and abilities of professional educators appropriate to their target credential or degree, including: Content, pedagogical, and/or professional knowledge relevant to the credential or degree sought
To examine our progress in preparing teacher candidates that exhibit content, pedagogical and professional knowledge relevant to the degree and credential sought, we selected three data sources: The EdQ Completer Survey, the Midterm and Final Fieldwork Evaluation, and the Site Visitation Project.
Data Sources & Analysis
Data Source 1
CSU Educator Quality Center (EDQ) Completer Survey
Description of Data Source:
Every year the CSU Educator Quality Center administers a survey to CSU teacher preparation
program completers at the time they complete their program. The routine, annual collection
of these data offer the program to look at Multiple Subject Program Completer perceptions
of preparedness longitudinally. Overall this survey tool aims to capture their perceptions
of preparation, and to measure their confidence in career placement and success. The
survey is aligned with the California Teaching Performance Expectations, serving as
a guide to the curriculum and clinical experiences of the Multiple Subject Credential
Program. This survey reports important insight into how our graduates’ perceive their
level of preparedness resulting from completing our program.
Perspective Captured from Data Source:
Candidates who completed the program from 2017-2020.
Rationale for Using Data Source:
This first measure we used to evaluate teacher candidates’ content, pedagogical and
professional knowledge includes eight (8) items from the CSU Educator Quality Center’s
Completion Survey, a survey distributed by the CSU Educator Quality Center. Although
content, pedagogy and professional knowledge can be broadly defined, we selected items
in this survey that we felt were the most representative of this area in our program.
Consequently, the focus of the items we chose is on standards-based curriculum planning,
using a variety of appropriate instructional methods and strategies, selecting appropriate
materials and resources for curriculum and instructional design, teaching critical/higher
level thinking skills and subject specific teaching for English Literacy and Language
Arts, teaching Mathematics, Science, and Social Studies.
Specific Elements of Data Source:
The items we selected to analyze include:
Candidate responses for: How well prepared did your program prepare you to do each of the following as a teacher?
- To plan and adapt instruction that incorporates appropriate strategies, resources, and technologies to meet the learning needs of all students.
- To use effective instructional strategies to teach specific subject matter and skills.
- To engage students in inquiry, problem solving, and reflection to promote their critical thinking.
- To select, adapt, and develop materials, resources, and technologies to make subject matter accessible to all students.
We’ve also used a cluster of items related to content addressed in the Multiple Subject Classroom:
- To teach English Literacy and Language Arts.
- To teach Mathematics.
- To teach Science.
- To teach History/Social Studies.
Definition of Success for Each Element:
The survey responses range from 1 - “Not At All Prepared” to 5 - “Very Well prepared.”
Our definition of success is that 85% of Multiple Subject Program Completers perceive
their level of preparedness positively within the 3 - 5 range or from “Adequately
Prepared” to “Well Prepared” to “Very Well Prepared.”
Displays of Analyzed Data:
The data displayed below reflects the following “Multiple Subject Program Completer
cohorts”: 2017-2018, 2018-2019, and 2019-2020.
Figure 1: 2017-2018 Multiple Subject Program Completers (N 179)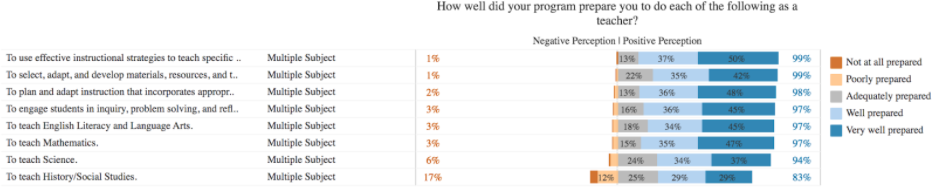
Figure 2: 2018-2019 Multiple Subject Program Completers (N 243)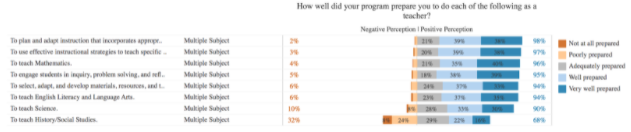
Figure 3: 2019-2020 Multiple Subject Program Completers (N 230)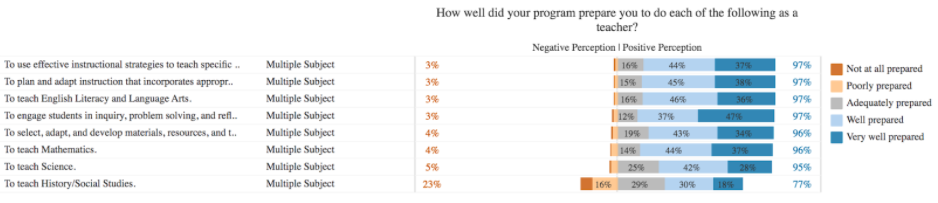
Link to Full Dataset: The link to the full dataset is unavailable. However, if reviewers would like to view the CSU Educator Quality Center Data Dashboards, we are happy to set up a time to provide them access by sharing screens in a Zoom session.
Interpretation of Data:
Multiple Subject Program Completers’ (MSPC) perceptions of their preparedness for
knowledge and skills related to content, pedagogical, and professional knowledge was
positive on seven of eight items across all three years. All but one item met the
goal of 85% or higher in positive perception. The only item that did not meet the
goal was MSPC perceptions of preparedness to teach History/Social Studies. The ability
to teach Science was also reported with less positive perception of preparedness all
three years but still surpassed the 85% program goal of positive prescription of preparedness.
Upon exiting our credential programs, candidates overall feel well prepared to design and implement instructional experiences using a variety of appropriate instructional methods and strategies, selecting appropriate materials and resources for curriculum and instructional design, teaching critical/higher level thinking skills and subject specific teaching for English Literacy and Language Arts, Mathematics, and Science. The one area for which improvement is most needed is in the program's ability to prepare candidates to teach Social Studies.
Data Source 2
Midterm & Final Fieldwork Evaluation (CREATe Rubric used formatively)
Description of Data Source:
The second measure is the Continuum of Reflective, Engaging, and Accessible Teaching
(CREATe) Rubric Midterm and Final Fieldwork Evaluation used by coaches to evaluate
candidates in their field work preparation at two intervals. CREATe integrates equity
and culturally and linguistically responsive pedagogy into the clinical practice feedback
cycle, measuring candidate development in 14 areas. This locally developed observation
tool provides a common language for preservice teachers, coaches, faculty, mentors,
and district administrators to orient their feedback in an actionable manner. Through
synthesis of existing district observation tools, and by aligning this synthesis to
the new Teacher Performance Expectations (2016 California Commission on Teacher Credentialing
/CCTC adopted Teaching Performance Standards/TPEs), the CREATe Rubric consists of 14 items organized within the following four domains: 1) Positive Environment, 2) Instructional Design and Implementation, 3) Rigorous
and Appropriate Content, and 4) Reflection-In-Action. Each of the 14 items is rated
along a seven-point developmental continuum with the following rating categories:
Unobserved, Attempting, Exploring, Emerging, Developing, Skillful, and Masterful.
Each rating category has an anchor descriptor that operationalizes each of the 14
items with action-oriented, observable “look-fors.”
Perspective Captured from Data Source: University Coach
Rationale for Using Data Source:
This internal measure is particularly important as our coaches, who are experienced
public-school educators, have the opportunity to provide ongoing formative feedback
in a collaborative and consultative environment. The rubric scores notwithstanding,
the program strives to instill in our candidates the notion that professional competence
grows incrementally through a combination of professional knowledge and experience.
This growth is mediated by the qualities our teacher candidates possess as they develop
their unique and individual teaching styles. Ultimately, the coaches evaluate our
candidates’ ability to apply the pedagogical content knowledge they receive in our
program in their student teaching field placement. This connection to the field is
an important bridge to the teacher induction efforts of the districts that hire our
candidates. In the Multiple Subject Program, we want to instill the norm in our teacher
candidates that learning and improving the teaching craft is an ongoing and lifelong
endeavor.
Specific Elements of Data Source:
On this internal measure, the two areas we selected to analyze directly address content,
pedagogy and professional knowledge. They are:
- Item 10: Critical & Creative Thinking
Aligned to TPE 1.5: Promote students' critical and creative thinking and analysis through activities that provide opportunities for inquiry, problem solving, responding to and framing meaningful questions, and reflection. - Item 11: Subject Matter Knowledge
Aligned to TPE 3.1 Demonstrate knowledge of subject matter, including the adopted California State Standards and curriculum frameworks.
The Midterm/Final Fieldwork Evaluation instrument rubric consists of the following five (5) levels of performance: 1. Unobserved: Not yet evident, 2. Attempting: Aware, may not be effective, 3. Exploring: Attempting, minimally effective, 4. Emerging: Consistently attempting, limited effectiveness, and 5. Developing: Consistently attempting, somewhat effective. Our hope is to see positive growth in these areas by the teacher candidates by comparing their placement on the rubric at the Midterm interval and in their Final Fieldwork Evaluation.
Typically, our candidates take courses in a three-phase program (although we do offer one program option that can be completed in two semesters). The second and third phase of the program includes student teaching experiences. The EHD 178 course is an initial student teaching experience that includes three days a week in a classroom setting. The EHD 170 is the final student teaching which requires candidates to be in the classroom every day. As the candidates’ progress through the phases, they take fewer courses and conduct more of the fieldwork pieces of our preparation program.
Definition of Success:
The Multiple Subject Program goals in relation to the CREATEe Rubric are that 75%
or more of our teacher candidates score at the Emerging (4) and Developing (5) levels
of the rubric in the Final Fieldwork Evaluation.
Displays of Analyzed Data:
We chose to analyze the data in a way that reported the percentage scores on each
level of the CREATe rubric in both the EHD 178 initial student teaching, and the EHD
170 final student teaching experiences (Tables 1-2). The Mid and Final Semester evaluation
reflected the Coaches’ ratings on how well our teacher candidates performed in Critical
and Creative Thinking and Subject Matter Knowledge. We looked at three cycles of
data which included Spring 2020, Fall 2020 and Spring 2021. We tallied the CREATe
Rubric ratings for our candidates and we reported the percentage that received a 4
(Emerging: consistently attempting) or a 5 (Developing: consistently attempting) on
the 5-point scale.
Table 1: Critical and Creative Thinking (Item 10), CREATe/Fieldwork Rubric, Mid and
Final Semester, 2020- 2021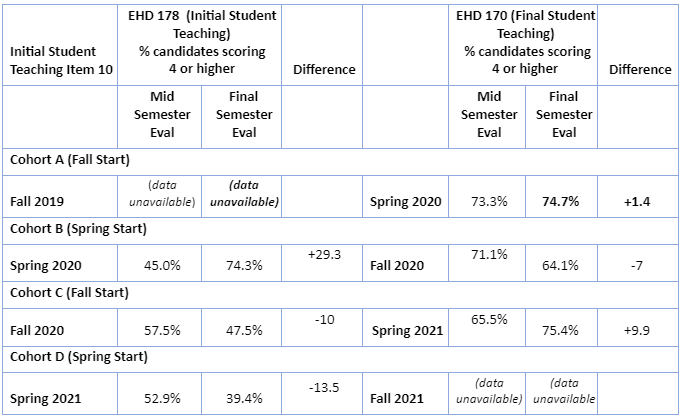
Table 2: Subject Matter Knowledge (Item 11), CREATe/Fieldwork Rubric Mid and Final
Semester, 2020-2021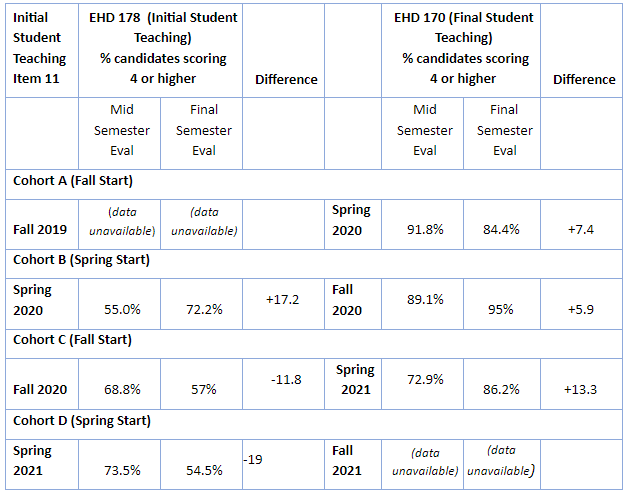
Link to Full Dataset: All CREATe PivotTables MS Field Placement
Interpretation of Data:
Item 11: Subject Matter Knowledge met the program’s goal of 75% or more of the teacher
candidates earning a 4 or 5 during final student teaching. This is a positive indicator
of the expected progression for a teacher candidate during a clinical practice apprenticeship
model, especially as time in coursework allows teacher candidates to strengthen their
pedagogical content knowledge. Although improvements were observed, this trend did
not emerge for item 10: Critical-Creative Thinking as the program goal was not met
for either phase of student teaching. One plausible explanation is that there is variance
in the depth to which program instructors engage teacher candidates in concrete concepts
such as the depth of knowledge framework. Another is that we often teach how we were
taught, and we continue to teach what we see in clinical contexts. The direct instruction
model still has a stronghold on the Tk-8 system in our region as such there are limited
examples of using an inquiry approach to provide Tk-8 students with intellectually
challenging activities that promote critical and creative thinking. That said, the
increase noticed during teacher candidate practice during final student teaching likely
has to do with the fact that the program engages its teacher candidates in an inquiry
series of coursework that culminates into a final collaborative, inquiry project with
students. And, yet we also know that many mentor teachers question why our teacher
candidates are required to do this assignment, placing stress on teacher candidates
that limits their potential in engaging Tk-8 students in critical and creative thinking.
It is important to note the time period that this data reports. Any growth and progress our candidates made during this period has to be considered remarkable in the context of the circumstances under which our teacher candidates were asked to perform. Student teaching during much of Spring 2020 and throughout the three semesters has mostly been accomplished in a virtual environment. COVID 19 has dramatically affected everything in our personal and professional lives and this needs to be considered in this evaluation.
Data Source 3
Fresno Assessment of Student Teachers II (FAST II): Site Visitation Project (SVP)
Description of Data Source:
The third measure we used to evaluate teacher candidates’ content, pedagogical and
professional knowledge is the Site Visitation Project, which is the first performance
assessment task in the Fresno Assessment of Student Teachers (FAST). The FAST is a Teaching Performance Assessment system designed specifically for use
in the teacher preparation program in Kremen School of Education and Human Development
at California State University, Fresno. The FAST instrument assesses the pedagogical
competence of teacher candidates with regard to the Teaching Performance Expectations
(TPE’s).
Although the FAST was originally developed and implemented about sixteen years ago, it has recently been modified to align with the revised assessment standards from California Commission on Teaching Credentialing (CCTC). Our Multiple Subject Program was also being revised at the same time to align with the new Teaching Performance Expectations. The revised assessment was piloted during the Fall 2017/Spring 2018 academic year and was approved by the California Department of Education in August 2018.
Perspective Captured from Data Source: University Coach
Rationale for Using Data Source:
Multiple subject candidates complete the Site Visitation Project during their initial
student teaching semester, which is in phase 2 of a traditional three-semester preparation
program. This task assesses our multiple subject teacher candidates’ ability to plan
a mathematics lesson that infuses English language development, teach the math lesson
to students, and evaluate their planning and implementation of the lesson. Throughout
each step of this assessment, teacher candidates are addressing subject specific pedagogy,
applying knowledge of students, and student engagement.
The Fresno Assessment of Student Teachers work products created by teacher candidates have been analyzed and evaluated by faculty and coaches who must be calibrated annually to score candidates’ work. Historically this data has been used for both summative and formative assessment purposes. It has a summative aspect as candidates must achieve passing scores on specific rubrics to continue in the program. It is also used formatively for our teacher candidates as feedback and opportunities for retakes are available for those candidates who do not pass in their first submission attempt. Faculty and coaches also use the data to adjust their teaching and supervision based on the outcome of the work students produce in a continuous feedback and adjustment loop.
Specific Elements of Data Source:
The SVP is scored on rubrics for the three separate components: 1) Planning, 2) Implementation,
and 3) Reflection. In the planning stage, teacher candidates create a class profile
describing important aspects of each individual student in their field placement and
summarizing class data including English proficiency, identified needs, ethnicity,
reading and writing proficiency. Teacher candidates develop a single lesson incorporating
mathematics state-adopted content standards and English Language Arts (ELA) and/or
English Language Development (ELD) adopted standards. They also create an activity/strategy
table to identify specific instructional activities or strategies that they have incorporated
into their lesson and justify how it addresses specific aspects of teaching. In the
implementation stage, the multiple subject teacher candidate teaches the lesson while
being observed by the university clinical coach. This lesson is also video recorded.
The reflection stage requires the teacher candidate to watch the video recording of
the lesson and evaluate their planning and instruction by addressing specific questions
related to subject specific pedagogy, applying knowledge of students, and student
engagement. Teacher candidates received written and verbal feedback on the Site Visitation
Project lesson from their clinical coach and mentor teachers after they have submitted
their reflection.
Definition of Success for Each Element:
Multiple Subject teacher candidates must score a 2 out of 4 or higher on each of the
three rubrics (Planning, Implementation, Reflection) of the Site Visitation Project
in order to achieve a passing score and continue in the program. Our program goal
is that our teacher candidates score at least a 3 on each component of the SVP. A
secondary goal is that our faculty and coaches adjust their instruction and support
of teacher candidates based on the results of the data from the Site Visitation Project.
Displays of Analyzed Data:
In the following analysis, we are including data from 5 semesters (Fall 2018 through
Fall 2020) to look for patterns of change over time. The revised Site Visitation Project
was approved in August 2018 so this data reflects the results of our assessment during
the first three semesters of full implementation. This also allows us to examine the
data over a continuous time period prior to the pandemic when schools were shut down
in March 2020.
In the Spring 2020 semester, the majority of our teacher candidates were unable to teach their SVP lesson in their initial student teaching field placement since school sites were shut down in the middle of the semester. Due to this situation, the majority of our multiple subject candidates in initial student teaching had to plan and teach their SVP lesson in the Fall 2020 semester. For the purpose of this analysis, we have grouped these students in the Spring 2020 semester to identify when they were in initial student teaching and when they should have completed this assessment.
Table 1: Site Visitation Project Distribution of Scores
Part 1: PLANNING
| Semester | Score 1 | Score 2 | Score 3 | Score 4 | Average Score |
|---|---|---|---|---|---|
| Fall 2018 (n=94) |
0% | 40.43% | 51.06% | 8.51% | 2.68 |
| Spring 2019 (n = 98) |
0% | 37.76% | 53.06% | 9.18% | 271 |
| Fall 2019 (n = 129) |
0.78% | 29.46% | 58.91% | 10.85% | 2.80 |
| Spring 2020 (n = 52) |
1.92% | 28.85% | 67.31% | 1.92% | 2.69 |
| Fall 2020 (n = 173) |
1.16% | 36.99% | 49.13% | 12.72% | 2.73 |
Part 2: IMPLEMENTATION
| Semester | Score 1 | Score 2 | Score 3 | Score 4 | Average Score |
|---|---|---|---|---|---|
| Fall 2018 (n=94) |
1.06% | 51.06% | 36.17% | 11.70% | 2.58 |
| Spring 2019 (n = 98) |
1.02% | 43.88% | 46.94% | 8.16% | 2.62 |
| Fall 2019 (n = 129) |
0.78% | 35.66% | 51.16% | 12.40% | 2.75 |
| Spring 2020 (n = 52) |
1.92% | 40.38% | 55.77% | 1.92% | 2.58 |
| Fall 2020 (n = 173) |
0% | 34.10% | 57.23% | 8.67% | 2.75 |
Part 3: REFLECTION
| Semester | Score 1 | Score 2 | Score 3 | Score 4 | Average Score |
|---|---|---|---|---|---|
| Fall 2018 (n=94) |
0% | 48.94% | 36.17% | 14.89% | 2.66 |
| Spring 2019 (n = 98) |
1.02% | 42.86% | 45.92% | 10.20% | 2.65 |
| Fall 2019 (n = 129) |
0% | 24.03% | 60.47% | 15.50% | 2.91 |
| Spring 2020 (n = 52) |
1.92% | 30.77% | 63.46% | 3.85% | 2.67 |
| Fall 2020 (n = 173) |
0.58% | 33.53% | 55.49% | 10.40% | 2.75 |
Table 2: Site Visitation Project: Distribution of average students’ scores across the three parts of the SVP (Note: students who received a 1 in at least one part of the SVP are included in the “Failed” percentage.)
| Percentage of passing scores by student average score | ||||||
|---|---|---|---|---|---|---|
| Semester | Failed 1 or more parts | 2.00 | 2.23 | 2.67 | 3.00 | 3.33 and higher |
| Fall 2018 (n=94) |
1.1% | 29.8% | 17.0% | 14.9% | 19.1% | 18.1% |
| Spring 2019 (n = 98) |
2.0% | 24.5% | 17.3% | 11.2% | 28.6% | 16.3% |
| Fall 2019 (n = 129) |
1.6% | 14.7% | 10.1% | 21.7% | 31.0% | 20.9% |
| Spring 2020 (n = 52) |
1.9% | 9.6% | 25.0% | 21.2% | 38.5% | 3.8% |
| Fall 2020 (n = 173) |
1.7% | 17.3% | 14.5% | 20.2% | 28.3% | 17.9% |
Link to Full Dataset: FAST Scores SVP
Interpretation of the Data:
On the Planning rubric table, there is a trend over the first four semesters of the
percentage of students scoring a 2 decreasing while the percentage of students earning
a 3 is increasing during this time period. The percentage of students failing with
a 1 in this component of the Site Visitation Project remains low for all 5 semesters.
There is a slight increase in the percentage of students earning a 4 in the planning
section with the exception of the spring 2020 semester. The average score for the
planning rubric increased slightly for the first three semesters, but the scores are
very similar over all five semesters.
The implementation rubric follows many of the same trends that we observed on the Planning rubric with a higher percentage of students earning a 3 on this component while the percentage of students earning a 2 are decreasing. The percentage of students earning a 3 improved each semester, but there was an increase in the percentages of 2 scores in the spring of 2020. The average score for implementation followed the same pattern as the planning rubric, but these scores are slightly lower.
The scores on the reflection rubric show the greatest changes in comparison to the other two sections of the rubric. Only 36% of students earned a 3 in the fall 2018 semester, but that number had increased to 63% in the spring 2020 semester. The percentage of students earning a 2 on the rubric decreased from 49% to 24% in the first three semesters. However, this percentage increased in the most recent two semesters.
We also examined the average student score for each semester. The percentage of students failing one or more sections of the SVP remained low for all 5 semesters. To earn a 2.00 average, a student needed to score a 2 in each section of the rubric. Over time, we are seeing the percentage of students scoring a 2.00 decreasing, but there was an uptick in the fall 2020 semester. In contrast, the percentage of students earning a 3.00 has doubled over the first four semesters from 19% to 38.5%. The students who earned a 3.33 or higher needed to earn a 4 in at least one category. However, if you ignore the spring 2020 semester that appears to be an outlier, there isn’t much variation between the other four semesters. The percentage of students earning a 3.33 or higher average ranged from 16% to 21%.
Next Steps Narrative:
After diligently combing through the CSU, Completer Survey, the Fieldwork Midterm
and Final Evaluation and the FAST data sources, the general conclusions are that we
are doing quite well in preparing elementary credential candidates for the teaching
field in the area of Pedagogical Content Knowledge (PCK) whereas improvements in the
area of Critical and Creative Thinking are warranted. Additionally, data systems to
accurately disaggregate the teacher candidate data by pathway must be developed so
the program can more fully understand the similarities and differences based on the
teacher candidates chosen pathway. Although the avenues for data analysis for this
report were not exhaustively comprehensive, they were representative in showing quantitatively
the many strengths that our program has, as well as some of the areas that could be
improved.
Some highlights in this area are:
FAST: The Fresno Assessment of Student Teachers continues to be a source of strength for
our program in the area of Pedagogical Content Knowledge. The Site Visitation Project
data demonstrates how much our candidates grow and improve as they proceed through
our program. An analysis of this data over the years of implementing the SVP indicates
that fewer candidates fail our SVP and more of them score in the higher ranges of
the rubric as they participate in our program. The other significant feature of the
FAST is the formative aspect that occurs because it is an in-house, internally developed
system where faculty and staff rate the work products produced by the candidates.
The FAST provides information that allows faculty, coaches and all involved personnel
to adjust program and instruction in a continuous cycle of improvement and implementation.
The added feature of being able to adjust our program based on the information we
receive from our internal measures could explain why our candidates have scored higher
in more recent years.
Continuous Improvement: In the pursuit of continually improving the program we must take a look at some of the results of the CSU Completer Survey data. We need to address why we have a small percentage of candidates who feel they are not at all prepared in the area of pedagogical and content knowledge, even after experiencing a rigorous three phase preparation program. Even more attainable would be to decrease the percentage of students who feel only adequately prepared as the number of candidates who felt this way is significant. In addition, we need to keep improving and adjusting the FAST system that gives us such valuable and meaningful information. Although there is extensive data, we must ensure that we are continuously using the data effectively. We must avoid the DRIP (Data Rich, Information Poor) syndrome in determining important and effective data sources. Since we plan to discontinue use of the CREATe Rubric (in part due to its unwieldy length at 14 pages), we have to select a quality rubric that is informative and manageable for all involved personnel in the essential area of fieldwork. Finally, we should examine and select various representative data sources that are connected more to the actual assignments and skills we use in our classrooms. These classroom assessments would add a qualitative aspect to evaluating our program that is currently missing. A mixed method approach to data collection and analysis would be more informative and authentic in looking at the way we prepare teachers for the classrooms of the future.