AAQEP Accreditation
Standard 1 Aspect E
Standard 1e: Evidence shows that, by the time of program completion, candidates exhibit knowledge, skills, and abilities of professional educators appropriate to their target credential or degree, including: Creation and development of positive learning and work environments
Data Sources & Analysis
Data Source 1
CSU Educator Quality Center Completer Survey
Perspective Captured from Data Source: Completers
Rationale for Using Data Source:
Every year the CSU Educator Quality Center administers a survey to CSU teacher preparation
program completers at the time they complete their program. The routine, annual collection
of these data allow the program to look at Multiple Subject Program Completer perceptions
of preparedness longitudinally. Overall this survey tool aims to capture their perceptions
of preparation, and to measure their confidence in career placement and success.
Specific Elements of Data Source:
The items we selected to analyze include candidate responses for “how well did your
program prepare you . . .”:
- To create a productive learning environment with high expectations for all students
- To develop social and emotional competencies in children (e.g., empathy, motivation, self-regulation)
- To engage students in cooperative group work as well as independent learning
- To handle a range of classroom management and or discipline situations
- To establish and maintain a safe and respectful learning environment for all students
Definition of Success:
On each item, candidates have the following five Likert-response options: 1 -Not at
all Prepared, 2 -Poorly Prepared, 3 -Adequately Prepared, 4 -Well Prepared, 5 -Very
Well Prepared, in order to indicate their perception of their preparation.
It is our program's goal to have 85% or more of candidates indicate positive preparedness perceptions within the 3 - 5 range or from “Adequately Prepared” to “Well Prepared” to “Very Well Prepared.”
Displays of Analyzed Data:
We chose to analyze disaggregated data from the past three cohorts of candidates in
order to determine if there were any trends in responses.
Figure 1: 2017-2018 Multiple Subject Program Completers (N 179)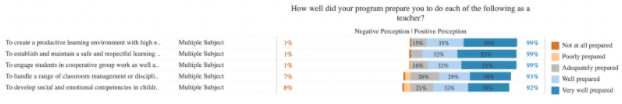
Figure 2: 2018-2019 Multiple Subject Program Completers (N 243)
Figure 3: 2019-2020 Multiple Subject Program Completers (N 230)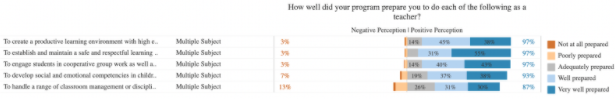
Link to Full Dataset: The link to the full dataset is unavailable. However, if reviewers would like to view the CSU Educator Quality Center Data Dashboards, we are happy to set up a time to provide them access by sharing screens in a Zoom session.
Interpretation of Data:
Based on the responses to the CSU Completer Survey, overall, candidates who completed
the Multiple Subject program from 2017 through 2020 indicated they were prepared to
create positive learning environments for their students. No items fell below 85%
in positive perception thereby meeting the program’s goal. An area of potential improvement
is in the program’s ability to support teacher candidates in developing the skills
needed to handle a range of classroom management or discipline situations and to develop
social and emotional competencies in children as these items were consistently rated
the lowest across the three years. Upon exiting our credential program, Multiple Subject
Credential candidates overall feel well prepared to create and develop positive learning
environments for TK-6 students.
Data Source 2
Midterm & Final Fieldwork Evaluation (CREATe Rubric used formatively)
Perspective Captured from Data Source: University Coach
Rationale for Using Data Source:
The CREATe Rubric, aligned to the California Teacher Performance Expectations (TPEs)
and California Standards for the Teaching Profession (CSTPs), is a research-based
observation rubric for use with teachers along the novice to expert continuum. This
tool is intended to be used formatively to guide candidate development of prioritized
skills, rather than as a summative assessment. During initial and final student teaching,
coaches use the instrument to evaluate candidates’ performance at the middle and again at the end of the semester.
Specific Elements of Data Source:
On this internal measure, two evaluated areas directly address candidate skills in
:
- Item 1 Caring Community
- Aligned to TPE 2.1: Promote students' social-emotional growth, development, and individual responsibility using positive interventions and supports, restorative justice, and conflict resolution practices to foster a caring community where each student is treated fairly and respectfully by adults and peers.
- Item 3 High Expectations
- Aligned to TPE 2.5: Maintain high expectations for learning with appropriate support for the full range of students in the classroom.
- Item 4 Positive Behavior Expectations
- Aligned to TPE 2.6: Establish and maintain clear expectations for positive classroom behavior and for student-to-student and student-to-teacher interactions by communicating classroom routines, procedures, and norms to students and families.
Definition of Success for Each Element:
Each item on the tool is scored on the following five (5) levels of performance: 1. Unobserved: Not yet evident, 2. Attempting: Aware, may not be effective, 3. Exploring:
Attempting, minimally effective, 4. Emerging: Consistently attempting, limited effectiveness,
and 5. Developing: Consistently attempting, somewhat effective.
The Multiple Subject Program goals are that 75% or more of our teacher candidates score at the Emerging (4) and Developing (5) levels of the rubric in the Final Fieldwork Evaluation.
Displays of Analyzed Data:
Table 1: Caring Community (Item 1), CREATe/Fieldwork Rubric, Mid and Final Semester,
2020-2021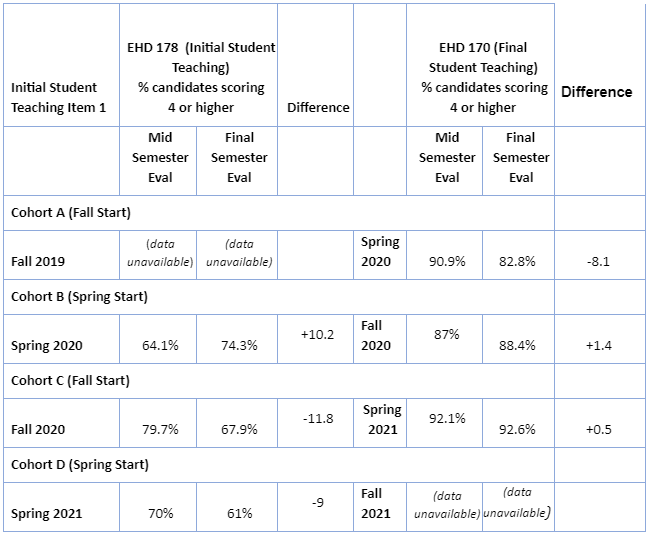
Table 2: High Expectations (Item 3), CREATe/Fieldwork Rubric, Mid and Final Semester,
2020- 2021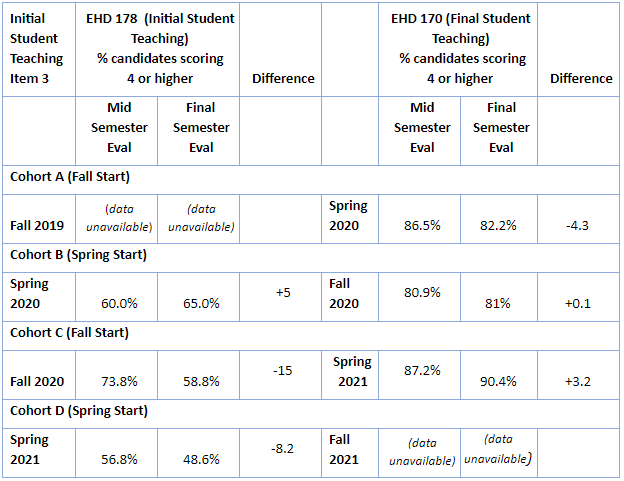
Table 3: Positive Behavior Expectations (Item 4), CREATe/Fieldwork Rubric, Mid and
Final Semester, 2020-2021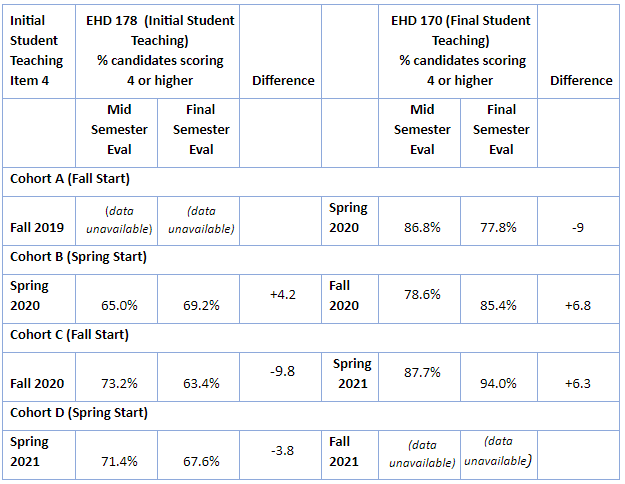
Link to Full Dataset: All CREATe PivotTables MS Field Placement
Interpretation of Data:
All three items met the program goal of 75% or more of the teacher candidates scoring
a 4 of 5 tables 1, 2 and 3. This is a positive indicator of the expected progression
for a teacher candidate during a clinical practice apprenticeship model. Acquiring
knowledge in the coursework, gaining classroom experience under the daily direction
of a mentor teacher, and getting valuable input throughout student teaching from experienced
coaches is an approach that is designed to enhance the abilities of our candidates
to excel in skill development over time. The data suggest that the teacher candidates
are well-prepared to create and develop positive learning environments for Tk-8 students.
Data Source 3
Fresno Assessment of Student Teachers II (FAST II): Site Visitation Project (SVP)
Perspective Captured from Data Source: University Coach & Program Faculty
Rationale for Using Data Source:
The third measure we used to evaluate teacher candidates’ content, pedagogical and
professional knowledge is the Site Visitation Project, which is the first performance
assessment task in the Fresno Assessment of Student Teachers (FAST). The FAST is a Teaching Performance Assessment system designed specifically for use
in the teacher preparation program in Kremen School of Education and Human Development
at California State University, Fresno. The FAST instrument assesses the pedagogical
competence of teacher candidates with regard to the Teaching Performance Expectations
(TPE’s).
Although the FAST was originally developed and implemented about sixteen years ago, it has recently been modified to align with the revised assessment standards from California Commission on Teaching Credentialing (CCTC). Our Multiple Subject Program was also being revised at the same time to align with the new Teaching Performance Expectations. The revised assessment was piloted during the Fall 2017/Spring 2018 academic year and was approved by the California Department of Education in August 2018.
Multiple subject candidates complete the Site Visitation Project during their initial student teaching semester, which is in phase 2 of a traditional three-semester preparation program. This task assesses our multiple subject teacher candidates’ ability to plan a mathematics lesson that infuses English language development, teach the math lesson to students, and evaluate their planning and implementation of the lesson. Throughout each step of this assessment, teacher candidates are addressing subject specific pedagogy, applying knowledge of students, and student engagement.
The SVP is scored on rubrics for the three separate components: 1) Planning, 2) Implementation, and 3) Reflection. In the planning stage, teacher candidates create a class profile describing important aspects of each individual student in their field placement and summarizing class data including English proficiency, identified needs, ethnicity, reading and writing proficiency. Teacher candidates develop a single lesson incorporating mathematics state-adopted content standards and English Language Arts (ELA) and/or English Language Development (ELD) adopted standards. They also create an activity/strategy table to identify specific instructional activities or strategies that they have incorporated into their lesson and justify how it addresses specific aspects of teaching. In the implementation stage, the multiple subject teacher candidate teaches the lesson while being observed by the university clinical coach. This lesson is also video recorded. The reflection stage requires the teacher candidate to watch the video recording of the lesson and evaluate their planning and instruction by addressing specific questions related to subject specific pedagogy, applying knowledge of students, and student engagement. Teacher candidates received written and verbal feedback on the Site Visitation Project lesson from their clinical coach and mentor teachers after they have submitted their reflection.
The Fresno Assessment of Student Teachers work products created by teacher candidates have been analyzed and evaluated by faculty and coaches who must be calibrated annually to score candidates’ work. Historically this data has been used for both summative and formative assessment purposes. It has a summative aspect as candidates must achieve passing scores on specific rubrics to continue in the program. It is also used formatively for our teacher candidates as feedback and opportunities for retakes are available for those candidates who do not pass in their first submission attempt. Faculty and coaches also use the data to adjust their teaching and supervision based on the outcome of the work students produce in a continuous feedback and adjustment loop.
Specific Elements of Data Source:
Planning Domain of the Site Visitation Project Rubric.
Note: The Planning Domain of the Site Visitation Project includes Student Engagement aligned to the following TPEs:
- 1.1 - Apply knowledge of students, including their prior experiences, interests, and social-emotional learning needs, as well as their funds of knowledge and cultural, language, and socioeconomic backgrounds, to engage them in learning.
- 1.3 - Connect subject matter to real-life contexts and provide active learning experiences to engage student interest, support student motivation, and allow students to extend their learning.
- 1.5 - Promote students' critical and creative thinking and analysis through activities that provide opportunities for inquiry, problem solving, responding to and framing meaningful questions, and reflection.
- 4.7 - Plan instruction that promotes a range of communication strategies and activity modes between teacher and student and among students that encourage participation in learning.
Definition of Success:
Multiple Subject teacher candidates must score a 2 out of 4 or higher on the Planning
Domain of the Site Visitation Project Rubric in order to achieve a passing score and
continue in the program. Our program goal is that our teacher candidates score at
least a 3 on each component of the SVP. A secondary goal is that our faculty and coaches
adjust their instruction and support of teacher candidates based on the results of
the data from the Site Visitation Project.
Displays of Analyzed Data:
In the following analysis, we are including data from 5 semesters (Fall 2018 through
Fall 2020) to look for patterns of change over time. The revised Site Visitation Project
was approved in August 2018 so this data reflects the results of our assessment during
the first three semesters of full implementation. This also allows us to examine the
data over a continuous time period prior to the pandemic when schools were shut down
in March 2020.
In the Spring 2020 semester, the majority of our teacher candidates were unable to teach their SVP lesson in their initial student teaching field placement since school sites were shut down in the middle of the semester. Due to this situation, the majority of our multiple subject candidates in initial student teaching had to plan and teach their SVP lesson in the final phase of student teaching during Fall 2020 semester. For the purpose of this analysis, we have grouped these students in the Spring 2020 semester to identify when they were in initial student teaching and when they should have completed this assessment.
Table 4: Teaching Sample Distribution of Scores for Planning
| Semester | Score 1 | Score 2 | Score 3 | Score 4 | Average Score |
|---|---|---|---|---|---|
| Fall 2018 (n=94) |
0% | 40.43% | 51.06% | 8.51% | 2.68 |
| Spring 2019 (n = 98) |
0% | 37.76% | 53.06% | 9.18% | 2.71 |
| Fall 2019 (n = 129) |
0.78% | 29.46% | 58.91% | 10.85% | 2.80 |
| Spring 2020 (n = 52) |
1.92% | 28.85% | 67.31% | 1.92% | 2.69 |
| Fall 2020 (n = 173) |
1.16% | 36.99% | 49.13% | 12.72% | 2.73 |
Link to Full Dataset: FAST Scores SVP
Interpretation of Data:
Data is presented for the Site Visitation Project -Planning dominant for the previous
five semesters. The data illustrates that upon program completion candidates demonstrate
strong abilities to plan for engaging students including varied methods appropriate
to students in their clinical placement class (e.g. real-life contexts, connections
to students’ experiences or interests, opportunities for critical or creative thinking,
varied communication strategies). Consistently over 98% of candidates earn a passing
score on this component. Further, across all five semesters an upward trend is noticed
in the percentage of candidates scoring a 3 or better.
Next Steps:
In order to address what we found, we will open up a discussion with faculty about
where issues of classroom management and discipline is embedded in the program, and
to determine what additional steps can be taken to improve the program’s ability to
support teacher candidates in developing the skills needed to handle a range of classroom
management or discipline situations. We will develop a change idea and test it out
to see if it leads to an improvement.
To evaluate our efforts in this area, we will revisit the CSU Program Completer Survey Items related to the creation and development of positive learning environments on an annual basis to monitor related trends.