AAQEP Accreditation
Standard 1 Aspect A
Standard 1A: Evidence shows that, by the time of program completion, candidates exhibit knowledge, skills, and abilities of professional educators appropriate to their target credential or degree, including: Content, pedagogical, and/or professional knowledge relevant to the credential or degree sought.
Data Sources & Analysis
Data Source 1
Final Semester Field Placement Evaluation
Description of Data Source:
Candidates in the Single Subject Program receive a formal evaluation both their initial
(EHD 155A) and final (EHD 155B) student teaching. For this data source, the program
purposely chose to report the results of the Final Semester Evaluations as it captures
less coursework and more full-time solo or co-teaching.
The University Coaches rate candidates on a scale of 1-4 with 1 as “Does not meet Expectations” and 4 as “Exceeds Expectations.”
Perspective Captured from Data Source: University Coach
Rationale for using Data Source:
The Final Evaluation provides a way to assess how well candidates are able to use
their knowledge of content and pedagogy during their actual instruction. For the purpose
of evaluating their development of subject-specific knowledge and pedagogy, we chose
to use Category 3: Subject-Specific Pedagogy from the evaluation.
Specific Elements of Data Source Using the Final Semester Evaluation:
Combined scores for Category 3: Subject-Specific Pedagogy
- To relate lesson objectives and instruction to integrate content and literacy standards.
- To include a variety of instructional and engagement strategies
- To provide opportunities for critical and creative thinking
- To utilize a range of communication or communication or activity modes
Definition of Success:
Programmatically, our candidates can pass by meeting the minimal expectations (score
of 2). However, the goal of the program is for our candidates to meet the expectations
at a high level (score of 3) and/or exceed expectations (score of 4) on their Final
Semester Evaluation. This internal measure is particularly important as it reflects
the shifting role from student teacher to classroom teacher.
Table 1: EHD 155B Rubric Scores for Final Semester Evaluation: Category 3
| - | Fall 2019 (n=16) |
Spring 2020 (n=55) |
Fall 2020 (n=24) |
|---|---|---|---|
| Exceeds Expectations | 1 (6.25%) | 14 (21.21%) | 1 (3.85%) |
| Meets Expectation at High Level | 8 (50%) | 35 (53.03%) | 12 (38.46%) |
| Meets Expectations | 4 (25%) | 17 (25.76%) | 11 (42.31%) |
| Does Not Meet Expectations | 1 (6.25%) | 0 (0%) | 4 (15.38%) |
| N/A | 2 (12.5%) | 0 (0%) | 0 (0%) |
| Mean | 2.64 | 2.95 | 3.24 |
| Median | 3.0 | 3.0 | 3.0 |
| Mode | 3.0 | 3.0 | 3.0 |
Link to Full Dataset:
Data Interpretation:
Note: The small number of students included in the analysis is due to a change in
the way data were collected. Prior to Spring 2020, all records were kept on hard copy.
We were in the process of transitioning those records to our online database when
the university was shut down due to COVID. In Fall 2021, we finally have all coaches
transitioned to recording scores from our evaluations in our online database.
The Fall 2019 Final Semester Evaluations results reflect the scores of 16 students. Of these 16 students, 25% (n=4) met the expectation (score of 2) 50% (n=8) met the expectations at a high level (score of 3), 6.25%(n=1) exceeded expectations (score of 4), and 6.25% (n=1) did not meet the expectations (score of 1). The most frequent score (the mode) is a 3 followed by a 2. The mean for this category is a 2.64 with a standard deviation of .72. Even though 81.25% of our students met or exceeded expectations, only 56.25% exceeded at a high level (score of 3) or exceeded expectations (score of 4) on the required indicators of the rubric.
The Spring 2020 Final Semester Evaluation results reflect the scores of 55 students. Of these 55 students, 25.76% (n=17) met the expectation (score of 2) 53.03% (n=35) met the expectations at a high level (score of 3), 21.21% (n=14) exceeded expectations (score of 4), and 0% did not meet the expectations (score of 1). The most frequent score (the mode) is a 3 followed by a 2. The mean for this category is a 2.95 with a standard deviation of .68. Even though 100.00% of our students met or exceeded expectations, only 74.24% exceeded at a high level (score of 3) or exceeded expectations (score of 4) on the required indicators of the rubric.
The Fall 2020 Final Semester Evaluations results reflect the scores of 24 students. Of these 24 students, 15.38% (n=4) met the expectation (score of 2) 42.41% (n=11) met the expectations at a high level (score of 3), 38.46% (n=10)exceeded expectations (score of 4), and 0% did not meet the expectations (score of 1). The most frequent score (the mode) is a 3 followed by a 4. The mean for this category is 3.24 with a standard deviation of .71. Even though 96.155% of our students met or exceeded expectations, only 86.77% exceeded at a high level (score of 3) or exceeded expectations (score of 4) on the required indicators of the rubric.
Data Source 2
Fresno Assessment of Student Teaching (FAST) - Teaching Sample Project (TSP)
Description of Data Source:
The Teaching Sample Project is one of two tasks in the Fresno Assessment of Student
Teachers (FAST) that collectively measure the pedagogical competence of teacher candidates
and interns for Preliminary Teaching Credentials in California, and as information
useful for determining program quality and effectiveness. To complete the TSP, candidates
are required: (a) to identify the context of their classroom (i.e. students and classroom
environment), (b) to plan and teach a series of at least five cohesive lessons (a
unit of study) with a focus on content knowledge and literacy, (c) to assess students’
learning before, during, and after the unit, (d) to document their teaching and their
students’ learning, and (e) reflect on the effectiveness of their teaching. The assessment
is scored using specific, task-focused rubrics. All coaches in the Ag Specialist program
are calibrated to score the assessment.
Perspective Captured from Data Source: University Coach
Rationale for Using Data Source:
The Learning Outcomes section of the TSP requires candidates to provide a description
of the unit that includes how it meets the state-adopted standards for subject matter
content knowledge and literacy skills. They are to describe how these standards will
be addressed in the unit and provide a rationale for why the unit is appropriate for
the students enrolled in the class. The rationale should address the appropriateness
for the students in the class in terms of: 1) development of content knowledge and
literacy skills, 2) connections to past learning and experience, 3) relevance to the
students in the class, and 4) importance for future learning.
Specific Elements of Data Source:
Teaching Sample Project rubric for Learning Outcomes (TPE 3.1, 3.2, 3.3)
Overall score for Two Areas:
- Learning Outcomes and Standards
- Appropriateness for Students
Definition of Success for Each Element: Programmatically, our goal is for all candidates to score at least a 2.0 (out of 4.0) by their completion of their fieldwork experience
Table 2. Statistical summaries of student rubric scores for TSP Section 2: Learning Outcomes
| - | Spring 2019 | Fall 2019 | Spring 2020 |
|---|---|---|---|
| Number of candidates | 123 | 45 | 120 |
| Mean Rubric Score (Attempt 1) | 2.55 | 2.56 | 2.72 |
| Mode | 2 | 2 | 3 |
| Second Mode | 3 | 3 | 2 |
| Lowest Score (score of 1) | 4.9% | 0.0% | 1.08% |
| Highest Score (score of 4) | 9.8% | 8.9% | 10.8% |
| Standard Deviation (Attempt 1) | 0.74 | 0.62 | 0.66 |
| Students Passing Attempt 1 | 117 | 41 | 119 |
| % Passing Attempt 1 | 95.12% | 91.71% | 99.17% |
Link to Full Dataset:
Interpretation of Data:
The Spring 2019 Learning Outcomes TSP results show the mode or the most frequently occurring score is 2, closely followed by the
score of 3 (meets with high expectations). Of the 123 students, 9.8% (n=12) exceeded
the expectation by reaching the highest score of 4; whereas six students (4.9%) received
a score of 1. The mean for this TSP is 2.55 with a standard deviation of .74. Impressively
95.1% of the students met (score of 2) or exceeded (score of 4) the required indicators
on the rubric: learning outcomes and standards, and appropriateness for students.
For Fall 2019 Learning Outcomes TSP show the mode or the most frequently occurring score is 2 (meets expectations), closely followed by the score of 3 (meets with high expectations). Of the 45 students, 6.7% (n=35) exceeded the expectation by reaching the highest score of 4; whereas no students (100%) received a score of 1. The mean for this TSP is 2.56 with a standard deviation of .62. Impressively 100% of the students met (score of 2) or exceeded (score of 4) the required indicators on the rubric: implications for instruction, and creating and maintaining effective environments
For Spring 2020 Learning Outcomes TSP, the mode or the most frequently occurring score is 3 (meets with high expectations), closely followed by the score of 2 (meets expectations). Of the 120 students, 10.8% (n=13) exceeded the expectation by reaching the highest score of 4; whereas one student (.8%) received a score of 1. The mean for this TSP is 2.72 with a standard deviation of .66. Impressively 99.2% of the students met (score of 2) or exceeded (score of 4) indicators on the rubric: learning outcomes and standards, and appropriateness for students.
Data Source 3
CSU Educator Quality Center Completer Survey
Description of Data Source:
Each year, the CSU Educator Quality Center administers a survey to program completers
to learn their perceptions of how well the program prepared them in a number of areas
aligned with the California Commission on Teacher Credentialing’s Teaching Performance
Expectations (TPE). Program completers from all CSU campuses are invited to respond
to each item on a 1-5 scale, where 1 indicates they believed that they were “not at
all” prepared and 5 indicates they believe they were “very well” prepared.”
Perspective Captured from Data Source: Completer
Rationale for using Data Source:
CSU Educator Quality Center (EdQ) Completer Survey captures program completers’ anonymous
perspectives of how well the program prepared them at the conclusion of their teaching
credential coursework and field experiences, providing valuable insights into their
perceptions of the program.
Specific Elements of Data Source:
Items used from the EdQ Program Completer Survey include:
How well did the program prepare you:
- To teach my content area according to California academic standards in my grades
- To organize curriculum to teach content
- To use effective instructional strategies to teach specific subject matter skills
Definition of Success for Each Element:
Programmatically, our goal is for all candidates to say they were either “well” or
“very well” prepared once they exit the program
Displays of Analyzed Data
Figure 1. 2017-2018 Completer responses for program perception items related to content and
pedagogical learning. (n=184)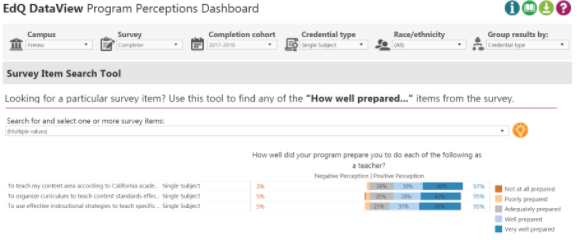
Figure 2. 2018-2019 Completer responses for program perception items related to content and
pedagogical learning (n=178)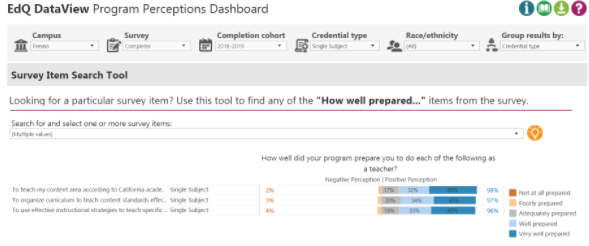
Figure 3. 2019-2020 Completer responses for program perception items related to content and
pedagogical learning (n=160)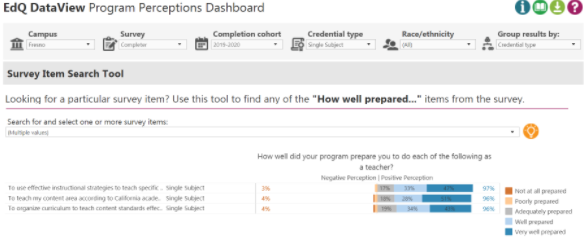
Link to Full Dataset: The link to the full dataset is unavailable. However, if reviewers would like to view the CSU Educator Quality Center Data Dashboards, we are happy to set up a time to provide them access by sharing screens in a Zoom session.
Interpretation of Data:
The 2017-2018 EdQ completer surveys (Figure 1), reported on the findings from 184 student responses to the items directly tied
to Section 2 of the TPEs and Aspect 1A. Of these, 95% of respondents indicated an
overall positive perception responding to the item gauging how well prepared they
felt “To teach my content area according to California academic standards in my grades.”
This included 41.80% (n=72) indicating they felt “very well prepared,” 28.30% (n=52)
indicating “well prepared,” and 35.00% (n=46) indicating adequately prepared. 97%
of respondents indicated an overall positive perception responding to the item that
asked how well prepared they felt “To organize curriculum to teach content.” This
included 41.80% (n=77) indicating they felt “very well prepared,” 29.90% (n=55) indicating
“well prepared,” and 25.50% (n=47) indicating adequately prepared. Lastly, 95% of
respondents indicated an overall positive perception responding to the item gauging
how well prepared they felt “To use effective instructional strategies to teach specific
subject matter skills ” This included 43.50% (n=80) indicating they felt “very well
prepared,” 31.0% (n=57) indicating “well prepared,” and 20.70% (n=38) indicating adequately
prepared. Across all three EdQ 2017-2018 items, the interpretation for the 2017-2018
EdQ findings is that at least 72% of our program completers felt that they were at
least “very well to well” prepared in the area of subject-matter or content and pedagogical
learning.
The 2018-2019 EdQ completer surveys (Figure 2), reported on the findings from 178 student responses to the items directly tied to Section 2 of the TPEs and Aspect 1A. Of these, 98% of respondents indicated an overall positive perception responding to the item gauging how well prepared they felt “To teach my content area according to California academic standards in my grades.” This included 48.60% (n=86) indicating they felt “very well prepared,” 32.20% (n=57) indicating “well prepared,” and 16.90% (n=30) indicating adequately prepared.97% of respondents indicated an overall positive perception responding to the item gauging how well prepared they felt “To organize curriculum to teach content.” This included 42.70% (n=77) indicating they felt “very well prepared,” 34.30% (n=61) indicating “well prepared,” and 19.00% (n=35) indicating adequately prepared. Lastly, 96% of respondents indicated an overall positive perception responding to the item gauging how well prepared they felt “To use effective instructional strategies to teach specific subject matter skills ” This included 45.20% (n=80) indicating they felt “very well prepared,” 32.80% (n=58) indicating “well prepared,” and 18.10% (n=32) indicating adequately prepared. Across all three EdQ 2018-2019 items, the interpretation for the 2018-2019 EdQ finding is that at least 78% of our program completers felt that they were at least “very well to well” prepared in the area of subject-matter aka content and pedagogical learning.
The 2019-2020 EdQ completer surveys (Figure 3), reported on the findings from 160 student responses to the items directly tied to Section 2 of the TPEs and Aspect 1A. Of these, 96% of respondents indicated an overall positive perception responding to the item gauging how well prepared they felt “To teach my content area according to California academic standards in my grades.” This included 50.60% (n=81) indicating they felt “very well prepared,” 28.10% (n=45) indicating “well prepared,” and 17.500% (n=28) indicating adequately prepared. 96% of respondents indicated an overall positive perception responding to the item gauging how well prepared they felt “To organize curriculum to teach content.” This included 42.80% (n=68) indicating they felt “very well prepared,” 34.00% (n=54) indicating “well prepared,” and 19.50% (n=31) indicating adequately prepared. Lastly, 97% of respondents indicated an overall positive perception responding to the item gauging how well prepared they felt “To use effective instructional strategies to teach specific subject matter skills ” This included 47.20% (n=75) indicating they felt “very well prepared,” 33.30% (n=53) indicating “well prepared,” and 17.00% (n=27) indicating adequately prepared. Across all three EdQ items for 2019-2020, the interpretation for the 2019-2020 EdQ finding is that at least 79% of our program completers felt that they were at least “very well to well” prepared in the area of subject-matter aka content and pedagogical learning.
Next Steps:
Overall, the three data sources demonstrate that our Single Subject Teaching Credential
Candidates are well-prepared and/or have met the expectations to understand content,
pedagogical, and/or professional knowledge relevant to the Single Subject Teaching
Credential. However, it is very interesting to note that our university coaches
scored our candidates as having “met'' their Final Semester Evaluation expectations;
whereas, the candidates themselves felt that they were “well Prepared” as evident
in the EdQ Completer Survey. It's also interesting to note that the passing rate of
the TSP seems to be relatively higher than the Final Semester Evaluation scores, indicating
perhaps that the coaches have higher expectations for the candidates specifically
assigned to them.
Additionally, there is a significantly lower amount of Final Semester evaluations recorded in our data management system, Tk20, than TSP scores submitted on Tk20. This is partly due to the fact that the Single Subject Program experienced a change in how data were collected. However, it should be noted that data entry did rise the following semesters.
In order to address what we found, the program, in particular the FAST Coordinator, will work with the Academic Subject Matter Advisors, to ensure that they understand the importance of the final semester evaluation surveys. In turn, the Academic Subject Matter Advisors will reach out to the coaches of our final student teachers to increase the reliability factor of the final semester evaluations. It is also expected that communication will occur that will cross reference the results of this training with the TSP evaluators, aka the university coaches, in order to raise the rating results of the final semester evaluation from a level of expectations (rating of a 2) to exceed with high expectations (rating of a 4).
Also worth noting is that, while most of our credential candidates felt prepared, it is not significant to say that we are preparing them properly. Therefore, the program needs to establish a better support system for ensuring that our credential candidates receive higher ratings on their Final Semester Evaluations and on their TSP. To evaluate our efforts, the program will collect and analyze Final Semester Evaluation, TSP Scores, and EdQ survey data on a semester basis rather than on an annual basis. These results will then be communicated at our end of the semester meetings at all levels (Academic subject matter advisors, final student teacher coaches, and SS program faculty).