AAQEP Accreditation
Standard 1 Aspect E
Standard 1E: Evidence shows that, by the time of program completion, candidates exhibit knowledge, skills, and abilities of professional educators appropriate to their target credential or degree, including: Creation and development of positive learning and work environments
Data Sources & Analysis
Data Source 1
CSU Educator Quality Center Completer Survey
Description of Data Source:
Each year, the CSU Educator Quality Center administers a survey to program completers
to learn their perceptions of how well the program prepared them in a number of areas
aligned with the California Commission on Teacher Credentialing’s Teaching Performance
Expectations (TPE). Program completers from all CSU campuses are invited to respond
to each item on a 1-5 scale, where 1 indicates they believed that they were “not at
all” prepared and 5 indicates they believe they were “very well” prepared.”
Perspective Captured from Data Source: Completer
Rationale for using Data Source:
CSU Educator Quality Center Completer Survey captures program completers’ anonymous
perspectives of how well the program prepared them at the conclusion of their teaching
credential coursework and field experiences, providing valuable insights into their
perceptions of the program.
Specific Elements of Data Source:
Selected items used from the CSU Educator Quality Center Program Completer Survey
include:
How well did your program prepare you to do each of the following as a teacher:
- To establish and maintain a safe and respectful learning environment for all students
- To create a productive learning environment with high expectations for all students
- To engage students in cooperative group work as well as independent learning
Definition of Success:
Programmatically, our goal is to have 85% of candidates indicate that they are Well
Prepared or Very-Well Prepared in each area.
Data Analysis:
We chose to analyze aggregate data from the past three cohorts of candidates, as
well as disaggregated data from each cohort in order to determine if there were any
trends in responses.
Figure 1: 2018-2019 through 2020-2021 Responses to CSU Educator Quality Center Survey Items Related to Creating and Maintaining Positive Learning and Work Environments
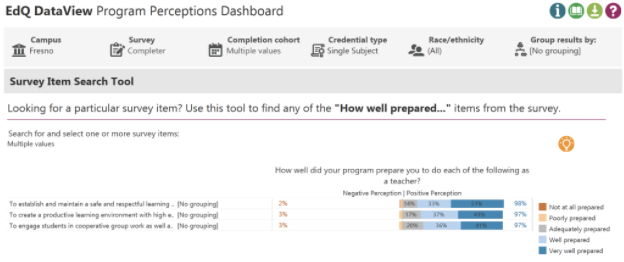
Figure 2: 2018-2019 CSU Educator Quality Center Completer Responses for Items Related to Creating and Maintaining Positive Learning and Work Environments (n=184)
Figure 3: 2019-2020 CSU Educator Quality Center Completer Survey Responses for Items Related to Creating and Maintaining Positive Learning and Work Environments (n=164)

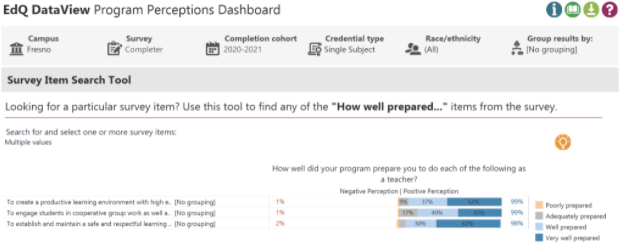
Figure 4: 2020-2021 CSU Educator Quality Center Completer Survey Responses for Items Related to Creating and Maintaining Positive Learning and Work Environments (n=89)
Link to Full Dataset:
Reviewers: If you would like to view the CSU Educator Quality Center Data Dashboards, we are happy to set up a time to provide access by sharing screens in a Zoom session.
Interpretation of the Data:
Based on the responses to the CSU EDQ Completer Survey, overall, candidates who completed
the Single Subject program in 2019 through 2021 indicated they were prepared to create
positive learning environments for their students (Figures 1-4). Specifically, 84% of responders indicated they were very well or well-prepared
to “establish and maintain a safe and respectful learning environment for all students,”
while just 2% indicated they were poorly prepared or not at all prepared in this area.
Similarly, 80% of respondents indicated that they were very well or well-prepared
to create a productive learning environment with high expectations for all students,
while just 3% indicated they were poorly prepared or not at all prepared in this area.
Seventy-seven percent of respondents also indicated they were very well or well-prepared
to engage students in cooperative group work as well as independent learning. Again,
3% of respondents indicated they were poorly prepared or not at all prepared in this
area.
Overall, the number of completers indicating they were very well prepared in each area either held steady or increased from year to year. This was especially true from 2019-2020 to 2020-2021 (Figures 3 & 4). However, it’s also worth noting that the total number of responders was significantly smaller in 2021. Still, of those who did respond, 92% indicated they were either well prepared or very well prepared to establish and maintain a safe and respectful learning environment, indicating this may be an area of strength for the program. The area in which completers consistently indicated they were just adequately prepared was in engaging students in cooperative group work as well as independent learning. This may be an area for the program to address moving forward.
Data Source 2
SPED 158, Universal Design for Learning Assignment
Description of Data Source:
All Single Subject candidates are required to take SPED 158: Differentiated Instruction
in Secondary Settings. Within this course, candidates apply what they have learned
about Universal Design for Learning (UDL) to design a learning environment that challenges
and engages all students.
Perspective Captured from Data Source: Faculty
Rationale for using Data Source:
The course grades reflect candidates’ ability to apply what they have learned about
Universal Design for Learning to design an effective learning environment that will
benefit all learners.
Specific Elements of Data Source:
A score of 9 to 10 points (22-24 in 2019) on post-test is considered mastery (successful)
Displays of Analyzed Data:
Table 1. UDL Assignment for SPED 158 Fall 2019, Spring 2020, and Spring 2021
| Cohort | Total Number Students | Score of 0-60% |
Score of 70-79% |
Score of 80-89% |
Score of 90-100% |
|---|---|---|---|---|---|
| Fall 2019 | 37 | 4 | 0 | 2 | 31 |
| Spring 2020 | 29 | 0 | 2 | 9 | 18 |
| Spring 2021 | 107 | 2 | 5 | 21 | 81 |
Link to Full Dataset:
Interpretation of Data:
For Fall 2019 (Table 1), there were 37 students. Of those 37 students, 31 (84%) scored 23-25 points for
the UDL assignment, 2 (5%) scored 20-22 points, and 4 (11%) scored 0-14 points. The
majority of students were able to meet assignment requirements (33) indicating a significant
understanding of UDL concepts as they apply to lesson planning.
For Spring 2020, the total number of students was 29. The average assignment score was 8.7, which falls below the mastery level of 90%. The majority of students (18) were at or above mastery level (90%) indicating their ability to design a UDL classroom which promotes a positive and appropriate school environment.
For Spring 2021, the total number of students was 107. The average assignment score was 9.1, which falls above the mastery level of 90%. The majority of students (81) were at or above mastery level (90%) indicating their ability to design a UDL classroom which promotes a positive and appropriate school environment
Data Source 3
Final Semester Field Placement Evaluation
Description of Data Source:
Candidates in the Single Subject Program receive a formal evaluation during both their
initial (EHD 155A) and final (EHD 155B) student teaching. The University Coaches provide
feedback to candidates on their teaching in five areas, each aligned with the California
Commission on Teacher Credentialing Teaching Performance Expectations (TPEs): Maintaining
Effective Environments, Monitoring Student Learning and Making Adjustments During
Lessons, Subject-Specific Pedagogy, Addressing Needs of All Students, and Assessment.
Candidates are rated in each area on a scale of 1-4, with 1 as “Does not meet Expectations”
and 4 as “Exceeds Expectations.”
Perspective Captured from Data Source: University Coach
Rationale for using Data Source:
The Final Evaluation provides a way to assess how well candidates are able to apply
the knowledge they learned through their coursework in their instruction. To evaluate
candidates’ ability to create and develop positive learning and work environments,
we chose Category 1: Maintaining Effective Environments, which aligns with the CCTC
Teaching Performance Expectations 2.1, 2.3, and 2.6.
Specific Elements of Data Source Using the Final Semester Evaluation:
Category 1: Maintaining Effective Environments, which includes:
- Creating expectations for, and responses to behavior in order to promote individual responsibility, multiple perspectives and inclusive environments for all students.
- Developing routines designed to facilitate independent learning and regular student to student interactions.
Definition of Success:
Programmatically, our candidates can pass by meeting the minimal expectations (score
of 2). However, it is the goal of the program for our candidates to meet the expectations
at a high level (score of 3) and/or exceed expectations (score of 4) on their Final
Semester Evaluation. This internal measure is particularly important as it reflects
the shifting role from student teacher to classroom teacher.
Displays of Analyzed Data
Table 2: EHD 155B Rubric Scores for Final Semester Evaluation: Category 1: Maintaining
Effective Environments
| - | Fall 2019 (n=16) |
Spring 2020 (n=55) |
Fall 2020 (n=24) |
|---|---|---|---|
| Exceeds Expectations | 4 (25%) | 17 (25.76%) | 9 (34.62%) |
| Meets Expectation at High Level | 4 (25%) | 33 (50%) | 12 (46.15%) |
| Meets Expectations | 5 (31.25%) | 16 (24.24%) | 4 (15.38%) |
| Does Not Meet Expectations | 1 (6.25%) | 0 (0%) | 0 (0%) |
| N/A | 2 (12.5%) | 0 (0%) | 0 (0%) |
| Mean | 2.79 | 3.02 | 3.20 |
| Median | 3.0 | 3.0 | 3.0 |
| Mode | 3.0 | 3.0 | 3.0 |
Link to Full Dataset:
Data Interpretation:
The Fall 2019 Final Semester Evaluations results reflect the scores of 16 students.
Of these 16 students, 31.25% (n=5) met the expectation (score of 2), 25% (n=4) met
the expectations at a high level (score of 3), 25%(n=4) exceeded expectations (score
of 4), and 6.25% (n=1) did not meet the expectations (score of 1). The most frequent
score (the mode) was a 2 followed by a 3. The mean for this category is a 2.79, with
a standard deviation of .94. Even though 81.25% of our students “met or exceeded
expectations, only 50% exceeded at a high level (score of 3) or exceeded expectations
(score of 4) on the required indicators of the rubric.
The Spring 2020 Final Semester Evaluations results reflect the scores of 55 students. Of these 55 students, 24.24% (n=16) met the expectation (score of 2), 50% (n=33) met the expectations at a high level (score of 3), 25.76% (n=17) exceeded expectations (score of 4), and 0% did not meet the expectations (score of 1). The most frequent score (the mode) is a 3 followed by a 4. The mean for this category is a 3.02 with a standard deviation of .71. Even though 100.00% of our students met or exceeded expectations, only 75.76% exceeded at a high level (score of 3) or exceeded expectations (score of 4) on the required indicators of the rubric.
The Fall 2020 Final Semester Evaluations results reflect the scores of 24 students. Of these 24 students, 15.38% (n=4) met the expectation (score of 2) 46.15% (n=12) met the expectations at a high level (score of 3), 34.62% (n=9) exceeded expectations (score of 4), and 0% did not meet the expectations (score of 1). The most frequent score (the mode) is a 3 followed by a 4. The mean for this category is 3.20 with a standard deviation of .69. Even though 100.00% of our students “met or exceeded expectations, only 80.77% exceeded at a high level (score of 3) or exceeded expectations (score of 4) on the required indicators of the rubric.
Overall, these scores indicate that the credential candidates in our program are able to design classrooms which promote a positive and appropriate school environment as the grand mean was 3.0.
Next Steps:
Data captured from the three data sources show that our Single Subject Teaching Credential
Candidates are prepared and/or have met the expectations to create and develop positive
learning and work environments relevant to the Single Subject Teaching Credential.
There were not many patterns that we could identify from this data; however, the
scores in the Final Evaluations tell a slightly different story, in that the coaches
see our credential candidates as needing more time in their field placements to build
relationships that foster a safe learning environment.
The program will also work more closely with the Office of Clinical Practice to extend the number of take-over weeks as a way to give our candidates more time in developing a positive and safe learning environment. To evaluate our efforts in this area, we will correlate the assignments with the reflections generated by our candidates regarding their fostering of safe learning environments.