AAQEP Accreditation
Standard 1: Aspect A
Standard 1a: Evidence shows that, by the time of program completion, candidates exhibit knowledge, skills, and abilities of professional educators appropriate to their target credential or degree, including: Content, pedagogical, and/or professional knowledge relevant to the credential or degree sought
Case for Standard 1a
The program selected three measures to study its preparation of teachers in the areas
of content, pedagogical, and/or professional knowledge relevant to the field: the
Site Visitation Project, the Intervention Project from SPED 246, and the CSU Completer
Survey.
Data Sources & Analysis
Data Source 1
Fresno Assessment of Student Teachers II (FAST II)
Description of Data Source:
The Site Visitation Project (SVP) is one part of our FAST assessments which measures
student performance related to the California Teacher Performance Expectations. The
FAST is integrated into candidates' clinical practice experiences with the SVP being
required during the first phase of student teaching. FAST went through a rigorous
review process by the California Commission on Teacher Credentialing. We also create
psychometric reports every two years, report data to the CTC, and are required to
revise when the CTC mandates.
Candidates develop, teach and reflect upon a standards-based content lesson in mathematics that they develop using state-adopted curriculum. Candidates are scored on their ability to incorporate subject specific pedagogy, apply knowledge of their students, and engage students at each stage of the lesson planning process and receive a composite score for Planning, Implementing, and Reflecting. Scoring for each element is completed by the candidate’s trained scorer, the University Coach, using a task-specific, four-point rubric that ranges from 1= Does not meet expectations to 4= Exceeds expectations
Perspective Captured from Data Source: University Coach
Rationale for Using Data Source:
The SVP assesses candidates’ knowledge, skills, and abilities in subject specific
pedagogy, applying knowledge of students, and student engagement in their first semester
of their field placement, midway through the program.
Specific Elements of Data Source:
Site Visitation Project overall rubric scores for: Planning, Implementation, and Reflection.
Each area includes the sub-areas of subject specific pedagogy, applying knowledge
of students, and student engagement
Definition of Success:
Teacher candidates must score a minimum of 2 points or higher out of 4 points on
each of the three elements, Planning, Implementation, Reflection, to achieve a passing
score on the Site Visitation Project. Even so, our program’s continuous improvement
goal is for our candidates to score a 3 on each element.
Displays of Analyzed Data:
Table 1: Site Visitation Project (SVP): Element One, Planning
| PLANNING (includes subject-specific pedagogy, knowledge of students, and student engagement) | Does Not Meet Expectations | Meets Expectations | Meets Expectations at a High Level | Exceeds Expectations | |
|---|---|---|---|---|---|
| Semester | Score=1 | Score=2 | Score=3 | Score=4 | Average |
| Spring 2018 n =38 |
0% | 44.7% | 39.4% | 15.7% | 2.71 |
| Fall 2018 n =20 |
0% | 55% | 40% | 5% | 2.5 |
| Spring 2019 n =13 |
0% | 23% | 76.9% | 0% | 2.77 |
| Fall 2019 n =19 |
0% | 68.4% | 31.5% | 0% | 2.32 |
| Spring 2020 n =62 |
0% | 40.3% | 54.8% | 4.8% | 2.65 |
| Fall 2020 n =62 |
1.6% | 46.7% | 46.7% | 4.8% | 2.55 |
| Average Percentage= | .004% | 46.35% | 48.22% | 5.05% | 2.58 |
Table 2: Site Visitation Project (SVP): Element Two, Implementation
| IMPLEMENTATION (includes subject-specific pedagogy, knowledge of students, and student engagement) | Does Not Meet Expectations | Meets Expectations | Meets Expectations at a High Level | Exceeds Expectations | |
|---|---|---|---|---|---|
| Semester | Score=1 | Score=2 | Score=3 | Score=4 | Average |
| Spring 2018 n =38 |
0% | 42.4% | 47.1% | 11% | 2.68 |
| Fall 2018 n =20 |
0% | 60.1% | 35% | 5% | 2.45 |
| Spring 2019 n =13 |
0% | 45.4% | 53.8% | 0% | 2.54 |
| Fall 2019 n =19 |
0% | 68.4% | 26.3% | 5.2% | 2.37 |
| Spring 2020 n =62 |
0% | 38.7% | 58% | 3.2% | 2.65 |
| Fall 2020 n =62 |
0% | 43.5% | 53.2% | 0% | 2.60 |
| Average Percentage= | .0% | 49.75% | 45.57% | 4.07% | 2.54 |
Table 3: Site Visitation Project (SVP): Element Three, Reflection
| REFLECTION (includes subject-specific pedagogy, knowledge of students, and student engagement) | Does Not Meet Expectations | Meets Expectations | Meets Expectations at a High Level | Exceeds Expectations | |
|---|---|---|---|---|---|
| Semester | Score=1 | Score=2 | Score=3 | Score=4 | Average |
| Spring 2018 n =38 |
0% | 50% | 42.1% | 8.8% | 2.58 |
| Fall 2018 n =20 |
0% | 45.4% | 50% | .05% | 2.6 |
| Spring 2019 n =13 |
0% | 23% | 69.2% | .08% | 2.85 |
| Fall 2019 n =13 |
5.2% | 42% | 52.6% | 0% | 2.42 |
| Spring 2020 n =62 |
0% | 32.2% | 64.5% | 3.2% | 2.71 |
| Fall 2020 n =62 |
0% | 38.7% | 56.5% | 4.8% | 2.66 |
| Average Percentage= | .004% | 38.55% | 55.82% | 2.82% | 2.64 |
Link to Full Dataset: Site Visitation Project Dataset
Interpretation of Data:
We compared the average of the individual percentages within each separate category
by element, including all six semesters in each composite average percentage. In doing
this, the overall composite percentages could be examined for trends from category
to category within each element rather than from semester to semester.
For Element 1: Planning, the average composite percentage (5.05%) of candidates who scored a 4 was much lower than our program expected. This is an area of growth our program will address. Altogether, 99.62% of our candidates are passing the Planning element of the Site Visitation Project with scores of 2 or higher across all six semesters included in this dataset.
For Element 2: Implementation, the percentage of Education Specialist candidates scoring a 2 or a 3 across the 6 semesters was 95.32%. However, the percentage of candidates who scored a 4 (4.07%) was again much lower than we expected. Still, overall, all of our candidates passed the Implementation element of the Site Visitation Project with scores of 2 or higher.
In Element 3: Reflection, the percentage of candidates who scored a 4 is 2.82%. 17.27% more of our Education Specialist candidates scored 3s on Reflection than scores of 2s, but fewer candidates scored 4s on Reflection. Overall, all but one candidate out of 214 passed the Reflection element of the Site Visitation Project with scores of 2 or higher. The one candidate met with the Program Coordinator and repeated the clinical experience course.
When comparing results across the elements, findings show that, overall, most candidates fell within the “Meet Expectations” and “Meet Expectations at a High Level” ranges, with significantly fewer candidates scoring “Exceeds Expectations.” In the element of Reflection, significantly more candidates scored “Meet Expectations at a High Level” than scored “Meet Expectations.” A very small percentage of candidates scored “Exceeds Expectations” for all three elements, Planning, Implementation and Reflection. The percentage of students failing one or more sections of the SVP remained extremely low across all six semesters.
Data Source 2
SPED 246 Intervention Project
Description of Data Source:
The second measure we used is the Intervention Project, an assignment in SPED 246:
Specialized Academic Instruction for Students with Mild/Moderate Disabilities. The
majority of our students (84%) are in the Mild/Moderate pathway, and this course is
in the final phase of both the credential and master’s level coursework. In this course,
candidates learn professional knowledge vital to their work as an Education Specialist:
- Appropriate methodology for the development, monitoring, and coordination of the Individualized Education Program (IEP)
- Methods for transition planning for students in grades TK-adult
- An array of research-based strategies that address specialized academic instruction for students with diverse learning needs, including emergent bilingual learners.
Scoring for each section of the project is completed by the candidate’s instructor using a task-specific thirty-point rubric score:
- 0-20= Does not meet expectations
- 21-23= Meets some expectations
- 24-26= Meets expectations
- 27-30= Exceeds expectations
Perspective Captured from Data Source: Program Faculty
Rationale for Using Data Source:
The Intervention Project is a culminating experience that requires candidates to focus on and provide specialized
academic instruction to one or more students with disabilities with whom they work
and who is/are struggling to learn, remember, and apply information that is taught
in the general education and/or special education setting. Because it asks candidates
to apply their professional knowledge in a real-world context, we believe it serves
as a valid measure of candidates’ pedagogical and professional knowledge.
Specific Elements of Data Source:
The elements selected from the rubric were parts 2-4:
- Part 2: Baseline Data (can candidates collect and analyze data?)
- Part 3: Instructional Design and Intervention (can they design effective instruction?)
- Part 4: Instructional Decision-Making (can they adjust instruction as needed?)
Definition of Success: Education Specialist candidates must score a minimum of 24 points (“Meets Expectations”) or higher out of 30 points on each of the three parts. Our program would also like to see an increasing trend in the number of candidates scoring in the “Exceeds Expectations” category.
Displays of Analyzed Data:
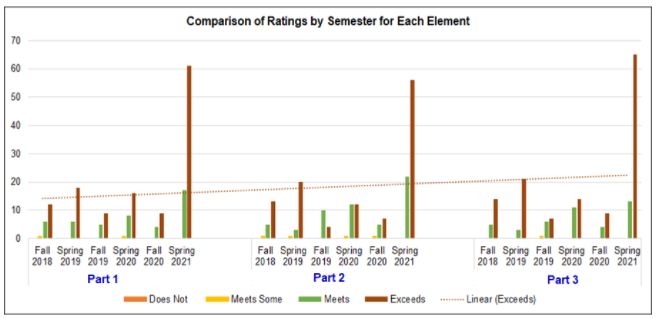
Figure 1, SPED 246 Intervention Project: Summary of Raw Data
n=173
Link to Full Dataset: SPED 246 Intervention Project Dataset
Interpretation of Data:
As shown in the graph above, in Part 2: Baseline, more candidates exceeded expectations
than met or met only some expectations. However, there were still a few candidates
struggling in this area.
In Part 3: Instructional Design, more candidates scored in the “Exceeded Expectations” category than in “Met” or in “Met Some Expectations.” However, the number of candidates scoring in the “Exceeding Expectations” was lower than for Part 2: Baseline or Part 4: Instructional Decision Making. Part 3 is an area of concern for some of our candidates. What we saw from the data and the candidates’ anecdotal notes were that candidates did not refer to the intervention data they collected as much as they should have during the instructional intervention as they did after instruction.
In Part 4: Instructional Decision Making, candidates exceeded expectations overall and seemed to understand instructional decision-making quite well. They were able to make changes to instruction or re-teach when needed, whether short- or long-term.
Data Source 3
CSU Education Quality Center Program Completer Survey
Description of Data Source:
Each year, the CSU Educator Quality Center administers a survey to program completers
to learn their perceptions of how well the program prepared them in a number of areas
aligned with the California Commission on Teacher Credentialing’s Teaching Performance
Expectations (TPE). Program completers from all CSU campuses are invited to respond
to each item on a 1-5 scale, where 1 indicates they believed that they were “not at
all” prepared and 5 indicates they believe they were “very well” prepared.” Fresno
State has a high rate of completion due to the efforts of our credential analyst who
requires completion as part of the credential application process.
Perspective Captured from Data Source: Program Completers
Rationale for using Data Source:
CSU Educator Quality Center Completer Survey captures program completers’ anonymous
perspectives of how well the program prepared them at the conclusion of their teaching
credential coursework and field experiences, providing valuable insights into their
perceptions of the program.
Specific Elements of Data Source:
The three items we felt were the most representative of content, pedagogy and professional
knowledge include:
How well did your program prepare you:
- Element 1: To plan for instruction by incorporating all relevant IFSP/IEP information, behavior and academic information.
- Element 2: To understand and use assessment data from a variety of sources to establish learning goals and to plan, differentiate and modify instruction.
- Element 3: To select, adapt, and develop materials, resources and technologies to make subject matter accessible to all students
Definition of Success for Each Element: Our definition of success:
- 0% reporting in the “Not at all Prepared” category
- 10% or less in the “Poorly Prepared” category
- Overall positive ratings 90% or higher
Displays of Analyzed Data:
Table 4, CSU Educator Quality Center Teacher Credential Program Completer Survey, Element 1, 2018-21
| Element 1: To plan for instruction by incorporating all relevant IFSP/IEP information, behavior and academic information. | |||
|---|---|---|---|
| Year | 2018-2019 N=61 |
2019-2020 N=52 |
2020-2021 N=52 |
| Not at all | 0% | 0% | 3.30% |
| Poorly Prepared | 6.30% | 1.60% | 3.30% |
| Adequately Prepared | 29.10% | 25.80% | 23.30% |
| Well Prepared | 31.60% | 38.70% | 36.70% |
| Very Well Prepared | 32.90% | 33.90% | 33.30% |
| Overall Negative | 6% | 2% | 6% |
| Overall Positive | 94% | 98% | 94% |
Table 5, CSU Educator Quality Center Teacher Credential Program Completer Survey, Element 2, 2018-21
| Element 2: To understand and use assessment data from a variety of sources to establish learning goals and to plan, differentiate and modify instruction. | |||
|---|---|---|---|
| Year | 2018-2019 N=61 |
2019-2020 N=52 |
2020-2021 N=52 |
| Not at all | 0% | 0% | 0% |
| Poorly Prepared | 4.90% | 5.80% | 0% |
| Adequately Prepared | 27.90% | 25% | 21% |
| Well Prepared | 34.10% | 36.50% | 35.40% |
| Very Well Prepared | 32.80% | 32.70% | 43.80% |
| Overall Negative | 5% | 6% | 0% |
| Overall Positive | 95% | 94% | 100% |
Table 6, CSU Educator Quality Center Teacher Credential Program Completer Survey, Element 3, 2018-21
| Element 3: To select, adapt, and develop materials, resources and technologies to make subject matter accessible to all students | |||
|---|---|---|---|
| Year | 2018-2019 N=61 |
2019-2020 N=52 |
2020-2021 N=52 |
| Not at all | 0% | 0% | 0% |
| Poorly Prepared | 4.90% | 5.80% | 0% |
| Adequately Prepared | 27.90% | 25% | 21% |
| Well Prepared | 34.10% | 36.50% | 35.40% |
| Very Well Prepared | 32.80% | 32.70% | 43.80% |
| Overall Negative | 5% | 6% | 0% |
| Overall Positive | 95% | 94% | 100% |
Link to Full Dataset: CSU Completer Survey Dataset
Interpretation of Data:
In Element 1, planning for instruction by incorporating all relevant IFSP/IEP information,
behavior and academic information, the target goal of 0% responses in the “Not at
all Prepared” category was met in 2018-2019 and 2019-2020. There were two candidates
who rated the program in the lowest category (3.3%) in 2020-2021. One possible contributing
factor in the 2020-2021 academic year was a lack of tenure-track faculty available
to teach credential courses. Through attrition, we had 3 full-time faculty, 2 tenure-track
and 1 full-time lecturer, available to teach our credential courses, which meant spreading
our part-time adjunct faculty over the remaining courses. All three full-time faculty
also had administrative duties. Consistently over three years, the responses were
higher for “Well Prepared” (31.6%-38.7%) and “Very Well Prepared” (32.9%-33.9%) than
for “Adequately Prepared” (23.3%-29.1%). Overall, the total positive responses (92-98%)
far outnumbered the negative ratings (2%-8%). We met our definition of success for
Element 1.
In Element 2, understanding and using assessment data from a variety of sources to establish learning goals and to plan, differentiate and modify instruction, the target goal of 0% responses in the “Not at all Prepared” category was met in all three years. Over three years, the responses were again higher for “Well Prepared” (34.1%-36.5%) and “Very Well Prepared” (32.7%-43.8%) than for “Adequately Prepared” (21%-27.5%). More candidates selected the highest two ratings than the three lowest ratings. Overall, the total positive responses (94-100%) far outnumbered the negative ratings (0%-6%). We met our definition of success for Element 2.
In Element 3, selecting, adapting, and developing, materials, resources and technologies to make subject matter accessible to all students, the target goal of 0% responses in the “Not at all Prepared” category was not met in the 2018-2019 (1.6%) but was met in 2019-2020 and 2020-2021. In the “Adequately Prepared” category, Element 3 had the lowest ratings range (14.6%-26.2%) over three years. The change results in higher ratings in the “Well Prepared” (34.4%-50%) category. There was also a higher and wider range of responses in the “Very Well Prepared” (26.9%-45.8%) category, resulting in the highest positive highest score for Element 3 at 45.8%. Again, more candidates selected the highest two ratings than the three lowest ratings. Overall, the total positive responses (96-98%) far outnumbered the negative ratings (2%-4%). We met our definition of success for Element 3.
Overall, the trend in responses for all three elements increased in the highest rating, “Very Well Prepared” over time, while the trend in responses in the lowest rating category, “Not at all Prepared”, decreased over time. The range of responses in the “Poorly Prepared” rating category ranged in percentages under 10%. It appears from the data that the trend in our candidates’ responses over time is that the program is preparing them in the three elements measured.
Next Steps Narrative:
In order to address what we found, we will carefully review our courses, and revise
assignments and rubrics where needed in order to ensure our candidates have the necessary
pedagogical and professional knowledge to support their students. Specifically, we
will examine the lesson planning and instruction our candidates receive from the special
education courses they take in their first and second phase to see where our program
can improve instruction and make revisions to course content.
Additionally, we will work to infuse more data analysis into Phase 2 and Phase 3 coursework along with a focus on how to use the findings from that analysis to inform instruction. We will also work to adjust rubrics to be more task-specific as we revise our program so that we can gather more specific data about candidates’ areas for growth.