AAQEP Accreditation
Standard 1 Aspect F
Standard 1f: Evidence shows that, by the time of program completion, candidates exhibit knowledge, skills, and abilities of professional educators appropriate to their target credential or degree, including: Dispositions and behaviors required for successful professional practice
To examine our program’s progress in preparing Education Specialist teacher candidates to exhibit dispositions and behaviors required for successful professional practice, our program selected elements from three different data sources: the Dispositions Survey, the Final Evaluation and final grades from candidates’ culminating clinical experience.
Data Sources & Analysis
Data Source 1
Post-Dispositions Survey
Description of Data Source:
In this first measure, candidates evaluate their own progress on six broad professional
dispositions in each of their three clinical experiences through the Pre- and Post-
Dispositions Survey. The professional dispositions include Reflection, Critical Thinking,
Professional Ethics, Valuing Diversity, Collaboration, and Life-long Learning. Each
of the six dispositions is subdivided into descriptors with which candidates self-assess
their progress. Candidates evaluate each disposition on a four-point Likert Scale,
ranging from No/limited evidence/application (value = 1) to Exceptional evidence/application
(value= 4 ). The Post-Dispositions Survey data are collected in candidates’ culminating
clinical experience.
Perspective Captured from Data Source: Candidate
Rationale for Using Data Source:
This data provides our program with the candidates’ perception of their progress on
some of the behaviors required for successful professional practice. These self-assessments
are key to understanding the perspectives of our candidates on their development of
these specific dispositions.
Note: The data collected from our data system, Tk20, was available only for Fall 2019, Spring 2019, Spring 2020, and Spring 2021. The reason that data are available for only those semesters is unknown, however, it may have to do with a change in the Tk20 binder format and forms.
Specific Elements of Data Source:
Three items from the Dispositions Survey in the areas of Professional Ethics and Life-Long
Learning:
- Shows commitment to ethical conduct: turns in assignments on time, is punctual and reliable in attendance, maintains professional appearance.
- Actively advocates for students and encourages student self-advocacy. Utilizes non-biased assessments.
- Seeks out opportunities to serve the school, students, and community (e.g., extracurricular activities, Big Brothers, Big Sisters).
Definition of Success for Each Element:
For each element, we expect to see ratings in the Satisfactory evidence/application
(value= 3) or Exceptional evidence/application (value= 4 ).
Displays of Analyzed Data:
Table 1: Post-Dispositions Survey, Element 1, 2020-21
| Element 1: Shows commitment to ethical conduct | ||||
|---|---|---|---|---|
| Semester | Fall 2020 n=20 |
Spring 2019 n=34 |
Spring 2020 n=2 |
Spring 2021 n=14 |
| Limited/no evidence/application | 0% | 0% | 0% | 0% |
| Some evidence/application | 16.70% | 2.90% | 50% | 7.10% |
| Satisfactory evidence/application | 50% | 38.20% | 0% | 42.80% |
| Exceptional evidence/application | 60% | 58.80% | 50% | 50% |
Table 2, Post-Dispositions Survey, Element 2, 2020-21
| Element 1: Shows commitment to ethical conduct | ||||
|---|---|---|---|---|
| Semester | Fall 2020 n=20 |
Spring 2019 n=34 |
Spring 2020 n=2 |
Spring 2021 n=14 |
| Limited/no evidence/application | 0% | 0% | 0% | 0% |
| Some evidence/application | 0% | 2.90% | 50% | 14.20% |
| Satisfactory evidence/application | 35% | 41.10% | 0% | 50% |
| Exceptional evidence/application | 65% | 55.80% | 50% | 35.70% |
Table 3, Post-Dispositions Survey, Element 3, 2020-21
| Element 1: Shows commitment to ethical conduct | ||||
|---|---|---|---|---|
| Semester | Fall 2020 n=20 |
Spring 2019 n=34 |
Spring 2020 n=2 |
Spring 2021 n=14 |
| Limited/no evidence/application | 0.05% | 2.90% | 50% | 7.10% |
| Some evidence/application | 15% | 17.60% | 50% | 42.80% |
| Satisfactory evidence/application | 40% | 58.80% | 50% | 42.80% |
| Exceptional evidence/application | 40% | 20.50% | 0% | 7.10% |
Figure 1: Post-Dispositions Survey, 2020-21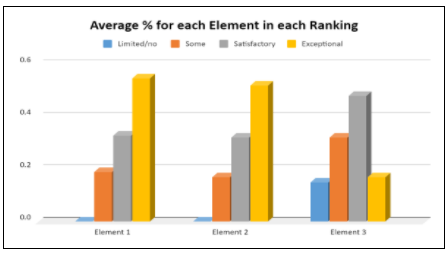
Link to Full Dataset: Standard 1f: Post-Dispositions Survey Dataset
Interpretation of Data:
The percentage of candidates’ selecting a ranking within each element was reviewed,
and the average percentages of each ranking for each element were compared to look
for areas of growth. It is worth noting that in spring 2020, we have an anomaly. There
were only two candidates whose scores on the Post-Dispositions Survey were collected,
so any ranking that was selected by either candidate would have resulted, at a minimum,
as a 50% rating.
In comparing the percentages and average overall percentages for each element in each ranking, the data show that Element 3 is a growth area for our program. Both of the lowest two rankings, “Limited or no evidence/application” and ”Some evidence/application” had the highest percentages in Element 3. The fact that any candidates selected the lowest rating, “Limited or no evidence/application” in Element 3 is a concern. While we acknowledge that our candidates are extremely busy in clinical experiences during the day, exhausted from attending classes in the evenings after 4:00 pm, and are often holding part-time jobs to support themselves, our program needs to encourage and model the value of service to the community for our candidates. As well, our program could emphasize the work our candidates are already doing but may not perceive as service. There were also rankings in the “Some evidence/application” for Elements 1 and 2 that need to be addressed over time.
Data Source 2
Final Fieldwork Evaluations
Description of Data Source:
In each phase of our three phase program, our candidates participate in clinical experiences.
During each clinical experience, candidates are evaluated on their field work preparation
at two intervals by their University Coaches. Part of the evaluative process is the
scoring of candidates’ progress on an internal, calibrated task-specific rubric called
CREATe.
Perspective Captured from Data Source: University Coach
Rationale for Using Data Source:
From the CREATe Rubric, we selected items from the “Professional Competencies” area
to provide feedback on our candidates’ progress on some of the behaviors required
for successful professional practice. We reviewed the only semesters for which data
was available in Tk20, our data management system: fall 2020, spring 20202, spring
2021.
Specific Elements of Data Source:
We selected three elements from the Professional Competencies area:
- Teaching Candidate demonstrates professionalism, including the responsible use of social media and other digital platforms and tools.
- Teaching Candidate is punctual and prepared.
- Teaching Candidate demonstrates caring, support, acceptance, and fairness toward all students, families, and colleagues
Definition of Success for Each Element:
Education Specialists should score 1s (Agree) or 2s (Strongly Agree) in each semester
on each of the elements. We expect that all of our candidates will score a 1 or above
on these items.
Table 4: Final Fieldwork Evaluation Rubric, Element 1, 2020-21
| Semester | Disagree - (0) | Agree - (1) | Strongly Agree - (2) |
|---|---|---|---|
| Fall 2020 n= 35 |
0% | 17.10% | 82% |
| Spring 2020 n= 45 |
2.20% | 26.60% | 66.70% |
| Spring 2021 n= 60 |
0% | 18.30% | 65% |
Table 5: Final Fieldwork Evaluation Rubric, Element 2, 2020-21
| Semester | Disagree - (0) | Agree - (1) | Strongly Agree - (2) |
|---|---|---|---|
| Fall 2020 n= 35 |
0% | 14.20% | 85.70% |
| Spring 2020 n= 45 |
2.20% | 13.30% | 80% |
| Spring 2021 n= 60 |
1.60% | 16.70% | 65% |
Table 6: Final Fieldwork Evaluation Rubric, Element 3, 2020-21
| Semester | Disagree - (0) | Agree - (1) | Strongly Agree - (2) |
|---|---|---|---|
| Fall 2020 n= 35 |
0% | 34.20% | 65.70% |
| Spring 2020 n= 45 |
2.20% | 20% | 73.30% |
| Spring 2021 n= 60 |
0% | 21.70% | 61.70% |
Figure 2, Ratings by Percentage in the Culminating Clinical Experience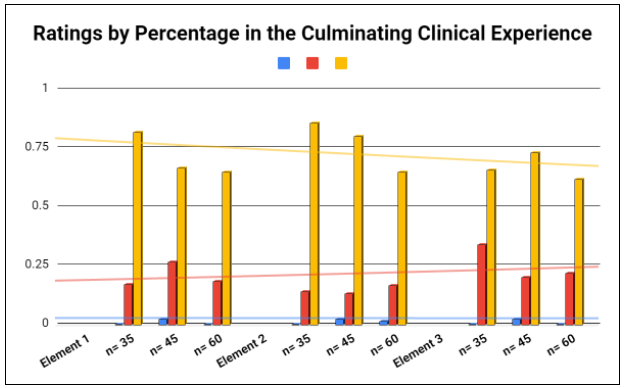
Link to Full Dataset: Final Fieldwork Evaluation Rubric Dataset
Interpretation of Data:
A comparison of the percentage of candidates in each rating for each element was conducted.
Across all three elements, there are candidates who scored in the “Disagree -0” rating.
Although the actual number of candidates receiving the lowest rating is small, the
fact remains that there are still a few teacher candidates who have difficulty with
their professional behaviors. This is very disappointing. The good news is that the
majority of candidates ranked in the “Agree (1)” or “Strongly Agree (2)” rating, with
most scoring in the “Strongly Agree” rating.
Trendlines were added to the chart. In the “Disagree” rating, the trendline is static. This is disappointing as we hoped to see a decrease in this rating. In the “Agree” rating, the trendline is going up, and an increase in the number of candidates in this rating shows positive growth. By contrast, the trendline in the “Strongly Agree” rating has gone down. A continuing decrease in the “Strongly Agree” ranking is something we need to watch.
Data Source 3
Final Clinical Practice Grades
Description of Data Source:
We selected the third measure, Final Clinical Practice Grades, to provide our program
with data over time of our candidates’ grades in the final clinical experience of
our program. Our University Coaches evaluate our candidates’ readiness to enter the
teaching profession based on their classroom observations, conversations with the
candidate, and consultation with the Mentor Teacher who sees the candidate in the
classroom on a regular basis.
Perspective Captured from Data Source: University Coach
Rationale for Using Data Source:
The grades given for clinical practice are an important indicator of their assessment
of candidates in the areas of professionalism and readiness to embark on a teaching
career. Six semesters of data were collected: spring 2018, fall 2018, spring 2019,
fall 2019, spring 2020 and fall 2020. We selected this third measure to provide our
program with a snapshot over time of our candidates’ grades in their final clinical
experience of our program. Seven semesters of data were collected: fall 2017, spring
2018, fall 2018, spring 2019, fall 2019, spring 2020 and fall 2020.
Specific Elements of Data Source:
Candidates’ grades for their final clinical experience
Definition of Success for Each Element:
95% of Education Specialist candidates will pass their final clinical experience with
a grade of A, B or CR (credit). Note: Courses are typically assigned a letter grade.
However, during the coronavirus pandemic, the university permitted students to request
a Credit / No Credit grade in lieu of a letter grade.
Displays of Analyzed Data:
Table 7: Grades in Final Clinical Practice, 2017-20
| Semester | A grades | B grades | Credit | D, F or No Credit grades |
|---|---|---|---|---|
| Fall 2017 n=19 |
18 | 1 | 0 | 0 |
| Spring 2018 n=38 |
32 | 6 | 0 | 0 |
| Fall 2018 n=73 |
68 | 5 | 0 | 0 |
| Spring 2019 n=46 |
38 | 1 | 6 | 1 |
| Fall 2019 n=38 |
19 | 3 | 15 | 1 |
| Spring 2020 n=48 |
29 | 0 | 16 | 3 |
| Fall 2020 n=28 |
20 | 0 | 8 | 0 |
Table 8: Percentage of students who earned passing/failing grades, 2017-20
| Semester | Failing grades: D, F or No credit |
Passing grades: A, B or Credit |
|---|---|---|
| Fall 2017 n=19 |
0% | 100% |
| Spring 2018 n=38 |
0% | 100% |
| Fall 2018 n=73 |
0% | 100% |
| Spring 2019 n=46 |
2.10% | 97.80% |
| Fall 2019 n=38 |
2.60% | 97.30% |
| Spring 2020 n=48 |
62.20% | 93.70% |
| Fall 2020 n=28 |
0% | 100% |
Figure 3: Final Grades in Final Clinical Practice Course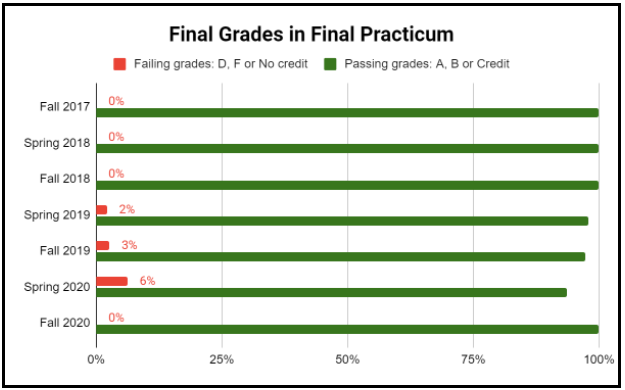
Link to Full Dataset: Final Clinical Practice Grades
Interpretation of Data:
In four out of seven semesters, 100% of the candidates passed their final practicum.
In three semesters, 93.7% - 97.8% passed. Failing rates ranged from 2%-6%, a total
of five candidates. All five of these candidates had been placed on Plans of Assistance
during the semester and offered additional support from their coach and program coordinator.
These five also had to decide whether or not they wanted to repeat final practicum
one time and try to pass with an A or B grade. Four of the five candidates elected
to repeat final practicum and passed on the second try. The fifth candidate left the
program. The overall percentage of candidates passing is 96.5%. Our program met its
goal.
Next Steps Narrative:
Overall, the data sources revealed a growing level of professionalism in our teacher
candidates. The majority of our candidates demonstrate growth in the dispositions
and behaviors that we hope for in teachers. Still, we understand that there are supports
we need to continue to provide. First, our program can organize and participate in
a few service projects for/with our candidates during the academic year. We can also
emphasize the service that our candidates are already performing but that they may
not have considered as service. Second, this semester we began offering a workshop
at the beginning of each semester on professional behaviors, a workshop we will continue
to offer at the beginning of each semester. Third, we will continue to develop extra
support to candidates who are struggling in their clinical practice experience to
support them to improve.
In addition, we recognize that we need to improve our data collection systems. This will be discussed in other areas of the QAR, however, here we wish to articulate two goals: 1) continue to collect data in the areas noted above 2) make the data available to tenured/tenure track, non-tenure track faculty and coaches, and staff. We feel that our program will strengthen the preparation of teacher candidates as we involve informed faculty, coaches, and staff in identifying candidates who may need extra attention. Making data more available will ensure that, when students ask for support, anyone in the program has information/data to draw on in addressing their needs.