AAQEP Accreditation
Standard 1 Aspect D
Standard 1d: Evidence shows that, by the time of program completion, candidates exhibit knowledge, skills, and abilities of professional educators appropriate to their target credential or degree, including: Assessment of and for student learning, assessment and data literacy, and use of data to inform practice
Data Sources & Analysis
Data Source 1
Midterm & Final Fieldwork Evaluation (CREATe Rubric used formatively)
Description of Data Source:
The first measure is the Continuum of Reflective, Engaging, and Accessible Teaching
(CREATe) Rubric Midterm and Final Fieldwork Evaluation used by coaches to evaluate
candidates in their field work preparation at two intervals. CREATe integrates equity
and culturally and linguistically responsive pedagogy into the clinical practice feedback
cycle, measuring candidate development in 14 areas. This locally developed observation
tool provides a common language for preservice teachers, coaches, faculty, mentors,
and district administrators to orient their feedback in an actionable manner. Through
synthesis of existing district observation tools, and by aligning this synthesis to
the new Teacher Performance Expectations (2016 CCTC adopted TPEs), the CREATe Rubric consists of 14 items organized within the following four domains: 1) Positive Environment, 2) Instructional Design and Implementation, 3) Rigorous
and Appropriate Content, and 4) Reflection-In-Action. Each of the 14 items is rated
along a seven-point developmental continuum with the following rating categories:
Unobserved, Attempting, Exploring, Emerging, Developing, Skillful, and Masterful.
Each rating category has an anchor descriptor that operationalizes each of the 14
items with action-oriented, observable “look-fors.”
Perspective Captured from Data Source: University Coach
Rationale for Using Data Source:
The CREATe Rubric, aligned to the California Teacher Performance Expectations (TPEs)
and California Standards for the Teaching Profession (CSTPs), is a research-based
observation rubric for use with teachers along the novice to expert continuum. We
use this tool formatively to guide candidate development of prioritized skills, rather
than as a summative assessment. During initial and final student teaching, coaches
use the instrument to evaluate candidates’ performance at the middle and again at the end of the semester.
Specific Elements of Data Source:
For the purposes of determining whether or not our candidates have the necessary knowledge
of and skills to apply assessment and data literacy to inform instructional practices,
we chose to focus on the rubric dimension “Monitoring Student Learning & Adjusting
Instruction.” This item evaluates candidates’ implementation of varied formative assessment
tools and strategies and use of the data gathered to adjust instructional practices.
- Item 14: Monitoring Student Learning and Adjusting Instruction
- Aligned with TPE 1.8: Monitor student learning and adjust instruction while teaching so that students continue to be actively engaged in learning.
Definition of Success for Each Element:
Each item on the tool is scored on the following five (5) levels of performance: 1. Unobserved: Not yet evident, 2. Attempting: Aware, may not be effective, 3. Exploring:
Attempting, minimally effective, 4. Emerging: Consistently attempting, limited effectiveness,
and 5. Developing: Consistently attempting, somewhat effective.
The Multiple Subject Program goals are that 75% or more of our teacher candidates score at the Emerging (4) and Developing (5) levels of the rubric in the Final Fieldwork Evaluation. This demonstrates that candidates consistently implement formative assessment strategies and frequently use the data to successfully adjust instructional practices.
Displays of Analyzed Data:
Table 1: Monitoring Student Learning and Adjusting Instruction (Item 14), CREATe/Fieldwork
Rubric Mid and Final, 2020-2021 period 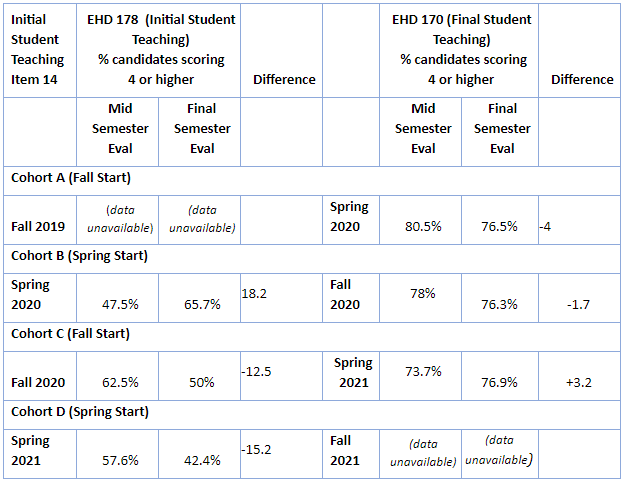
Link to Full Dataset: All CREATe PivotTables MS Field Placement
Interpretation of Data:
The program goal of 75% or more of the teacher candidates scoring a 4 of 5 during
final student teaching was met as seen in Table 1. This is a positive indicator of
the expected progression for a teacher candidate during a clinical practice apprenticeship
model. Acquiring knowledge in the coursework, gaining classroom experience under the
daily direction of a mentor teacher, and getting valuable input throughout student
teaching from experienced coaches is an approach that is designed to enhance the abilities
of our candidates to excel in skill development over time. The data suggest that the
teacher candidates have developed data literacy skills.
Data Source 2
Fresno Assessment of Student Teachers II (FAST II): Teaching Sample Project
Description of Data Source:
The FAST is a Teaching Performance Assessment system designed specifically for use
in the teacher preparation program in Kremen School of Education and Human Development
at California State University, Fresno. The FAST instrument assesses the pedagogical
competence of teacher candidates with regard to the Teaching Performance Expectations
(TPE’s).
Although the FAST was originally developed and implemented about sixteen years ago, it has recently been modified to align with the revised assessment standards from California Commission on Teaching Credentialing (CCTC). Our Multiple Subject Program was also being revised at the same time to align with the new Teaching Performance Expectations. The revised assessment was piloted during the Fall 2017/Spring 2018 academic year and was approved by the California Department of Education in August 2018.
Perspective Captured from Data Source: Program Faculty and University Coaches
Rationale for Using Data Source:
The Teaching Sample Project (TSP) is one of two tasks in the Fresno Assessment of
Student Teachers (FAST) that collectively measure the pedagogical competence of teacher
candidates and interns for Preliminary Teaching Credentials in California, and serve
as information useful for determining program quality and effectiveness. Candidates
complete the TSP during the final phase of the program. To complete the TSP, candidates
identify the classroom context (i.e. students and classroom environment); plan and
teach a series of at least 5 cohesive lessons (a unit of study) with a focus on content
knowledge and literacy; assess students’ learning before, during, and after the unit;
and reflect on the effectiveness of the instruction. The overall assignment is scored
using a rubric.
Specific Elements of Data Source:
For the purposes of determining whether or not our candidates exhibit knowledge of
assessment for and of student learning, we chose to focus on the rubric dimension
“Assessment Plan” (see Figure 1). In this section candidates select, adapt or develop
assessments to assist in (a) planning the unit (pre-assessments), (b) monitoring student
progress (formative assessments), and (c) measuring student learning (summative assessments).
Candidates describe the assessments, scoring, and evaluation criteria and provide
a rationale for the choice of assessments.
Figure 1: FAST-Teaching Sample Project- Assessment Plan Rubric
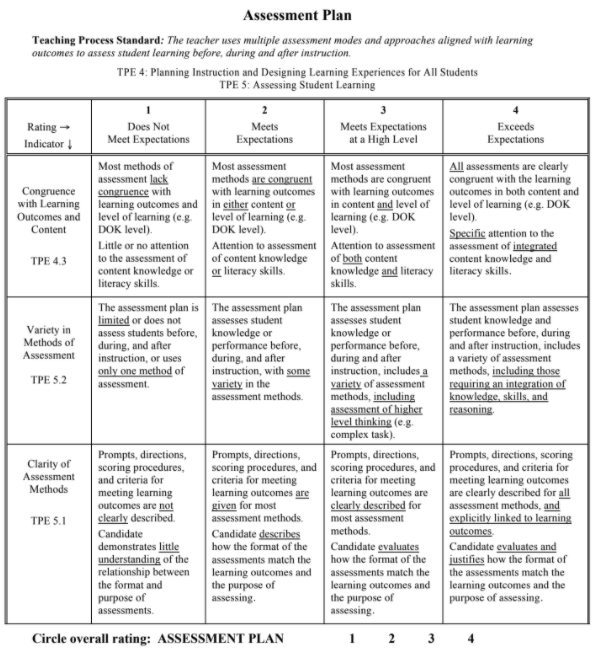
Definition of Success for Each Element:
Multiple Subject teacher candidates must score a 2 out of 4 on each of the rubrics
of the TSP in order to achieve a passing score. Our program goal is that our teacher
candidates score at least a 3 on each component of the TSP.
Displays of Analyzed Data:
Table 2: Teaching Sample Distribution of Scores for Assessment Plan
| Semester | Score 1 | Score 2 | Score 3 | Score 4 | Average Score |
|---|---|---|---|---|---|
| Fall 2018 (n=94) |
5% | 48% | 44% | 4% | 2.5 |
| Spring 2019 (n = 98) |
4% | 53% | 35% | 8% | 2.5 |
| Fall 2019 (n = 129) |
3% | 40% | 52% | 6% | 2.6 |
| Spring 2020 (n = 52) |
2% | 40% | 52% | 6% | 2.6 |
Link to Full Dataset: MS FAST Scores TSP
Interpretation of Data:
Data is presented for the Teaching Sample Project- Assessment Plan component for the
previous four semesters. The data illustrates that upon program completion candidates
demonstrate strong abilities to apply assessment literacy in the development of formative
and summative assessment procedures. Consistently over 95% of candidates earn a passing
score on this component. Further, during Fall 2019 and Spring 2020 an upward trend
is noticed in the percentage of candidates scoring a 3 or better.
Data Source 3
CSU Educator Quality Center Completer Survey
Description of Data Source:
Every year the CSU Educator Quality Center administers a survey to CSU teacher preparation
program completers at the time they complete their program. The routine, annual collection
of these data offer the program to look at Multiple Subject Program Completer perceptions
of preparedness longitudinally. Overall this survey tool aims to capture their perceptions
of preparation, and to measure their confidence in career placement and success. The
survey is aligned with the California Teaching Performance Expectations, serving as
a guide to the curriculum and clinical experiences of the Multiple Subject Credential
Program. This survey reports important insight into how our graduates’ perceive their
level of preparedness resulting from completing our program.
Perspective Captured from Data Source:
Candidate who completed the program from 2017-2020.
Rationale for Using Data Source:
We selected four items from the survey that focused on the Multiple Subject Program
Completers’ (MSPC) perspectives of how the program prepared them to understand, interpret,
and use assessment data. We also selected two items focused on the MSPC’ reports on
the frequency of assessment practices in their clinical experiences, which allows
us to gain a deeper understanding of how our candidates’ clinical experiences influence
their knowledge and application of assessment and data literacy.
Specific Elements of Data Source:
The third measure used to evaluate candidates’ ability to use assessment data to inform
their practice includes four (4) items from the CSU Educator Quality Center’s Program
Completer Survey.
The items we selected to analyze include candidate responses for how well did your program prepare you:
- To involve all students in self-assessment, goal setting, and monitoring progress
- To give productive feedback to students to guide their learning.
- To use data from student assessments to inform instruction.
- To evaluate the effects of your actions on student learning and modify plans accordingly.
- In your teacher preparation program, how much opportunity did you have to listen to an individual child read aloud for the purpose of assessing his/her reading achievement?
- In your teacher preparation program, how much opportunity did you have to use student reading assessment results to address student needs and improve your teaching?
Definition of Success for Each Element:
On each item, candidates have the following five Likert-response options: 1 -Not at
all Prepared, 2 -Poorly Prepared, 3 -Adequately Prepared, 4 -Well Prepared, 5 -Very
Well Prepared, in order to indicate their perception of their preparation.
It is our program's goal to have 85% or more of candidates indicate positive preparedness perceptions within the 3 - 5 range or from “Adequately Prepared” to “Well Prepared” to “Very Well Prepared.”
Displays of Analyzed Data:
We chose to analyze disaggregated data from the past three cohorts of candidates
in order to determine if there were any trends in responses.
Figure 1: 2017-2018 Multiple Subject Program Completers (N 179)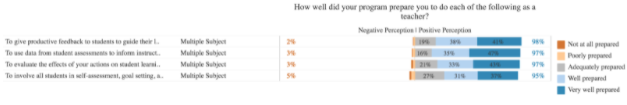
Figure 2: 2018-2019 Multiple Subject Program Completers (N 243)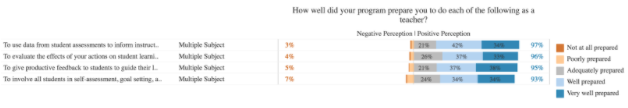
Figure 3: 2019-2020 Multiple Subject Program Completers (N 230)
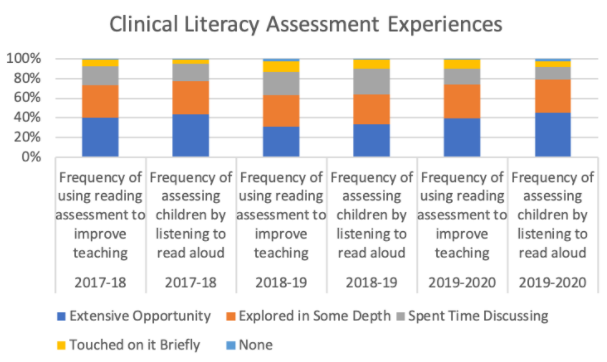
Figure 4: 2017-2020 Frequency of Clinical Literacy Assessment Experiences
Link to Full Dataset: The link to the full dataset is unavailable. However, if reviewers would like to view the CSU Educator Quality Center Data Dashboards, we are happy to set up a time to provide them access by sharing screens in a Zoom session.
Interpretation of Data:
The data collected over the last three years show a consistent trend that most of
our candidates feel well prepared with the data literacy skills required to administer
assessments and use data to inform instructional decisions. No items fell below 85%
in positive perception thereby meeting the program’s goal over the past three years.
The program’s ability to prepare candidates to involve all students in self-assessment,
goal setting and monitoring progress was reported as the least positive perception
of preparedness across all three years. The slight decline across the years may indicate
that the program may need to identify the assessment tools used during clinical experiences
and determine ways to integrate school district assessment tools and procedures across
various courses.
Similarly, the data show consistent trends in candidates’ reporting multiple opportunities to develop data literacy skills, particularly related to reading instruction, during clinical experiences. Though these results also indicate that nearly 20% of our candidates did not have such ample opportunities. Coupled with the previous data on sense of preparedness, more information might need to be gathered on clinical experiences with assessment and data literacy in other subject areas in addition to literacy.
Next Steps:
Overall the data analyzed for this aspect indicates that our program provides strong
support for our teacher candidates to develop assessment and data literacy skills.
Through this analysis we identified some areas for improvement, specifically, related
to candidates’ application of assessment and data literacy knowledge in clinical practice
contexts. To address this issue, our program will examine course assignments to identify
ways to strengthen the connections between courses and clinical experiences. The program
will also collaborate with clinical coaches to identify the reasons why candidates
are not exhibiting consistent assessment and data literacy skills during clinical
experiences.