AAQEP Accreditation
Standard 1 Aspect C
Standard 1C: Evidence shows that, by the time of program completion, candidates exhibit knowledge, skills, and abilities of professional educators appropriate to their target credential or degree, including: Culturally responsive practice, including intersectionality of race, ethnicity, class, gender identity and expression, sexual identity, and the impact of language acquisition and literacy development on learning.
Data Sources & Analysis
Data Source 1
Final Semester Field Placement Evaluation
Description of Data Source:
Candidates in the Single Subject Program receive a formal evaluation during both their
initial and final student teaching. The University Coaches provide feedback to candidates
on their teaching in five areas, each aligned with the California Commission on Teacher
Credentialing Teaching Performance Expectations (TPEs): Maintaining Effective Environments,
Monitoring Student Learning and Making Adjustments During Lessons, Subject-Specific
Pedagogy, Addressing Needs of All Students, and Assessment. Candidates are rated in
each area on a scale of 1-4, with 1 as “Does not meet Expectations” and 4 as “Exceeds
Expectations.”
Perspective Captured from Data Source: University Coach
Rationale for using Data Source:
The Final Evaluation provides a way to assess how well candidates are able to apply
the knowledge they learned through their coursework in their instruction. For the
purpose of evaluating their development of knowledge of culturally responsive practice,
we chose to use Category 4: Addressing the Needs of all Learners, which evaluates
how well candidates are able to adapt their instruction to meet the needs to the full
range of learners in the room, including those from culturally and linguistically
diverse backgrounds.
Specific Elements of Data Source:
Scores for Category 4: Addressing the Needs of all Learners:
- Selecting instructional approaches that are specifically designed to address:
- Full range of English proficiency levels
- Students with identified special needs
- Students with different instructional needs
Definition of Success:
Programmatically, our candidates can pass by meeting the minimal expectations (score
of 2). However, it is the goal of the program for our candidates to meet the expectations
at a high level (score of 3) and/or exceed expectations (score of 4) on their Final
Semester Evaluation. This internal measure is particularly important as it reflects
the shifting role from student teacher to classroom teacher.
Displays of Analyzed Data
Table 1: Rubric Scores for Final Semester Evaluation: Category 4: Addressing Needs
of All Learners
| - | Fall 2019 (n=16) |
Spring 2020 (n=55) |
Fall 2020 (n=24) |
|---|---|---|---|
| Exceeds Expectations | 0 (0%) | 11 (16.67%) | 1 (3.85%) |
| Meets Expectation at High Level | 8 (50%) | 35 (53.03%) | 7 (26.92%) |
| Meets Expectations | 5 (31.25%) | 20 (30.3%) | 13 (50%) |
| Does Not Meet Expectations | 1 (6.25%) | 0 (0%) | 5 (19.23%) |
| N/A | 2 (12.5%) | 0 (0%) | 0 (0%) |
| Mean | 2.5 | 2.86 | 3.24 |
| Median | 3.0 | 3.0 | 3.0 |
| Mode | 3.0 | 3.0 | 3.0 |
Link to Full Dataset:
Note: The small number of students included in the analysis is due to a change in the way data were collected. Prior to Spring 2020, all records were kept on hard copy. We were in the process of transitioning those records to our online database when the university was shut down due to COVID. In Fall 2021, we finally have all coaches transitioned to recording scores from our evaluations in our online database.
Data Interpretation:
The Fall 2019 Final Semester Evaluations results reflect the scores of 16 students.
Of these 16 students, 31.25% (n=5) met the expectation (score of 2) 50% (n=8) met
the expectations at a high level (score of 3), 0.0% (n=0) exceeded expectations
(score of 4), and 6.2% (n=1) did not meet the expectations (score of 1). The most
frequent score (the mode) is a 3 followed by a 2. The mean for this category is a
2.5 with a standard deviation of .63. Even though 81.5% of our students met or exceeded
expectations, only 55% exceeded at a high level (score of 3) whereas 0% exceeded expectations
(score of 4) on the required indicators of the rubric.
The Spring 2020 Final Semester Evaluations results reflect the scores of 55 students. Of these 55 students, 30.3% (n=20) met the expectation (score of 2) 53.03% (n=35) met the expectations at a high level (score of 3), 16.67% (n=11) exceeded expectations (score of 4), and 0% did not meet the expectations (score of 1). The most frequent score (the mode) is a 3 followed by a 2. The mean for this category is a 2.86 with a standard deviation of .67. Even though 100.00% of our students met or exceeded expectations, only 69.67% exceeded at a high level (score of 3) or exceeded expectations (score of 4) on the required indicators of the rubric.
The Fall 2020 Final Semester Evaluations results reflect the scores of 24 students. Of these 24 students, 19.23% (n=5) met the expectation (score of 2) 50.00% (n=13) met the expectations at a high level (score of 3), 26.92% (n=7) exceeded expectations (score of 4), and 0% did not meet the expectations (score of 1). The most frequent score (the mode) is a 3 followed by a 4. The mean for this category is 3.8 with a standard deviation of .69. Even though 91.15% of our students met or exceeded expectations, only 69.23% exceeded at a high level (score of 3) or exceeded expectations (score of 4) on the required indicators of the rubric.
Data Source 2
Pre-Post Disposition Survey
Definition of Data Source:
The Pre-Post Disposition Survey is administered to Single Subject candidates at the beginning of initial student
teaching and at the end of final student teaching in order for the candidates to self-assess
their professional dispositions from two viewpoints – BEFORE and AFTER participating
in the program.
Perspective Captured from Data Source: Candidates/ Program Completers
Rationale for using Data Source:
The dispositions on which candidates rate themselves include: reflection, critical
thinking, professional ethics, valuing diversity, collaboration, and lifelong learning.
The survey allows the program to examine how candidates rate themselves and any changes
in candidates’ dispositions from the beginning to the end of the program.
Specific Elements of Data Source Using the Pre-Post Disposition Survey:
Even though the survey measures six (6) dispositions, the category Valuing Diversity
was selected for our analysis for Standard 1C. Under this category there are four
sub-section items:
- Diagnoses learner's needs by interpreting data from diverse sources
- Develops lessons that are interesting and engaging utilizing a variety of instructional strategies to accommodate all learners, including those from diverse backgrounds, experiences, and cultures
- Facilitates the academic and social inclusion of students with special needs in various inclusive activities and environments.
- Differentiates instruction to allow students who differ widely in terms of their background, knowledge, learning styles/preferences, and orientation to school norms to reach common standards.
Definition of Success for Each Element:
Programmatically, our goal is for all candidates to show growth in how they rate themselves
related to each disposition across the two survey administrations (pre & post).
Table 1: Frequencies and Means of Candidates’ Ratings on Disposition Areas at the Beginning and End of the Program
| Diagnoses learner's needs by interpreting data from diverse sources | ||
|---|---|---|
| Cohort 1 | Fall 2019 | Spring 2020 |
| Total # Candidates | 94 | 92 |
| # Candidates Rating 1 | 8 | 0 |
| # Candidates Rating 2 | 66 | 8 |
| # Candidates Rating 3 | 74 | 55 |
| # Candidates Rating 4 | 48 | 29 |
| Mean of Candidate Ratings | 2.7 | 3.2 |
| Cohort 2 | Spring 2020 | Fall 2020 |
| Total # Candidates | 41 | 22 |
| # Candidates Rating 1 | 4 | 0 |
| # Candidates Rating 2 | 10 | 3 |
| # Candidates Rating 3 | 19 | 13 |
| # Candidates Rating 4 | 8 | 6 |
| Mean of Candidate Ratings | 2.8 | 3.1 |
| Cohort 3 | Fall 2020 | Spring 2021 |
| Total # Candidates | 104 | 87 |
| # Candidates Rating 1 | 8 | 0 |
| # Candidates Rating 2 | 33 | 9 |
| # Candidates Rating 3 | 48 | 44 |
| # Candidates Rating 4 | 15 | 34 |
| Mean of Candidate Ratings | 2.7 | 3.3 |
| Develops lessons that are interesting and engaging utilizing a variety of instructional strategies to accommodate all learners, including those from diverse backgrounds, experiences, and cultures | ||
|---|---|---|
| Cohort 1 | Fall 2019 | Spring 2020 |
| Total # Candidates | 94 | 91 |
| # Candidates Rating 1 | 3 | 0 |
| # Candidates Rating 2 | 23 | 6 |
| # Candidates Rating 3 | 47 | 47 |
| # Candidates Rating 4 | 21 | 38 |
| Mean of Candidate Ratings | 2.9 | 3.4 |
| Cohort 2 | Spring 2020 | Fall 2020 |
| Total # Candidates | 41 | 22 |
| # Candidates Rating 1 | 4 | 0 |
| # Candidates Rating 2 | 10 | 2 |
| # Candidates Rating 3 | 23 | 13 |
| # Candidates Rating 4 | 4 | 7 |
| Mean of Candidate Ratings | 2.8 | 3.2 |
| Cohort 3 | Fall 2020 | Spring 2021 |
| Total # Candidates | 104 | 87 |
| # Candidates Rating 1 | 11 | 0 |
| # Candidates Rating 2 | 24 | 2 |
| # Candidates Rating 3 | 49 | 40 |
| # Candidates Rating 4 | 20 | 45 |
| Mean of Candidate Ratings | 2.9 | 3.5 |
| Facilitates the academic and social inclusion of students with special needs in various inclusive activities and environments. | ||
|---|---|---|
| Cohort 1 | Fall 2019 | Spring 2020 |
| Total # Candidates | 94 | 92 |
| # Candidates Rating 1 | 5 | 0 |
| # Candidates Rating 2 | 26 | 8 |
| # Candidates Rating 3 | 45 | 49 |
| # Candidates Rating 4 | 17 | 35 |
| Mean of Candidate Ratings | 2.8 | 3.3 |
| Cohort 2 | Spring 2020 | Fall 2020 |
| Total # Candidates | 41 | 22 |
| # Candidates Rating 1 | 5 | 0 |
| # Candidates Rating 2 | 9 | 3 |
| # Candidates Rating 3 | 18 | 16 |
| # Candidates Rating 4 | 9 | 3 |
| Mean of Candidate Ratings | 2.9 | 3.0 |
| Cohort 3 | Fall 2020 | Spring 2021 |
| Total # Candidates | 104 | 87 |
| # Candidates Rating 1 | 13 | 1 |
| # Candidates Rating 2 | 29 | 9 |
| # Candidates Rating 3 | 43 | 40 |
| # Candidates Rating 4 | 19 | 37 |
| Mean of Candidate Ratings | 2.8 | 3.3 |
| Differentiates instruction to allow students who differ widely in terms of their background, knowledge, learning styles/preferences, and orientation to school norms to reach common standards. | ||
|---|---|---|
| Cohort 1 | Fall 2019 | Spring 2020 |
| Total # Candidates | 94 | 92 |
| # Candidates Rating 1 | 5 | 0 |
| # Candidates Rating 2 | 29 | 5 |
| # Candidates Rating 3 | 44 | 51 |
| # Candidates Rating 4 | 16 | 36 |
| Mean of Candidate Ratings | 2.8 | 3.4 |
| Cohort 2 | Spring 2020 | Fall 2020 |
| Total # Candidates | 41 | 22 |
| # Candidates Rating 1 | 4 | 0 |
| # Candidates Rating 2 | 8 | 2 |
| # Candidates Rating 3 | 18 | 15 |
| # Candidates Rating 4 | 11 | 5 |
| Mean of Candidate Ratings | 3.0 | 3.1 |
| Cohort 3 | Fall 2020 | Spring 2021 |
| Total # Candidates | 104 | 87 |
| # Candidates Rating 1 | 9 | 0 |
| # Candidates Rating 2 | 30 | 2 |
| # Candidates Rating 3 | 44 | 38 |
| # Candidates Rating 4 | 21 | 47 |
| Mean of Candidate Ratings | 2.8 | 3.5 |
Link to Full Dataset:
- Cohort 1 (Fall 2019-Spring 2020)
- Cohort 2 (Spring 2020-Fall 2020)
- Cohort 3 (Fall 2020-Spring 2021)
Interpretation of Data:
Programmatically, our goal is for candidates to demonstrate growth on each of the
key dispositions between when they begin the program and when they end the program.
Looking at the means for each of the four dispositions we believe align with engaging
in culturally responsive practice demonstrates that, indeed, as a whole, each cohort
demonstrated growth during its time in the program. In particular, Cohorts 1 and 2
showed significant increases between the beginning of their first semester and the
end of their second semester, frequently demonstrating an increase in mean ratings
of 0.5. This is particularly true of the final highlighted disposition, Differentiates
instruction to allow students who differ widely in terms of their background, knowledge,
learning styles/preferences, and orientation to school norms to reach common standards,
when Cohort 1 had an increase in its mean rating of 0.6 and Cohort 3 had an increase
in its mean rating of 0.7. We believe this demonstrates candidates’ confidence in
their own ability to be responsive to the students in the classroom with their instruction.
Looking at the frequencies of ratings, we are also pleased that, across all three cohorts, only one individual rated themselves a 1 (limited/no evidence), and that was only in the area of facilitates the academic and social inclusion of students with special needs in various inclusive activities and environments.. Seeing the overall trends in candidates’ ratings towards the 3 (satisfactory evidence) and 4 (exceptional evidence) again highlights the growth in candidates’ dispositions during their time in the program.
Data Source 3
CSU Educator Quality Center Completer Survey
Description of Data Source:
Each year, the CSU Educator Quality Center administers a survey to program completers
to learn their perceptions of how well the program prepared them in a number of areas
aligned with the California Commission on Teacher Credentialing’s Teaching Performance
Expectations (TPE). Program completers from all CSU campuses are invited to respond
to each item on a 1-5 scale, where 1 indicates they believed that they were “not at
all” prepared and 5 indicates they believe they were “very well” prepared.”
Perspective Captured from Data Source: Completer
Rationale for using Data Source
CSU Educator Quality Center Completer Survey captures program completers’ anonymous
perspectives of how well the program prepared them at the conclusion of their teaching
credential coursework and field experiences, providing valuable insights into their
perceptions of the program.
Specific Elements of Data Source:
Items used from the EdQ Program Completer Survey include:
How well did your program prepare you to do each of the following as a teacher:
- To engage in culturally responsive teaching
- To plan instruction based students prior knowledge, academic readiness, language proficiency, cultural background, and individual development
Definition of Success for Each Element:
Programmatically, our goal is for all candidates to indicate they were either “well
prepared” (4) or “very well prepared” (5) once they exit the program
Displays of Analyzed Data:
Figure 4. 2017-2018 CSU Educator Quality Center Completer Survey Responses for Items Related
to Culturally Responsive Teaching (n=183)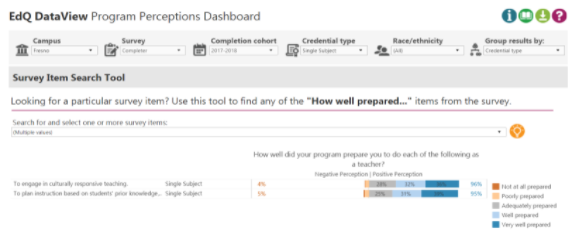
Figure 5. 2018-2019 CSU Educator Quality Center Completer Survey Responses for Items Related
to Culturally Responsive Teaching (n=178)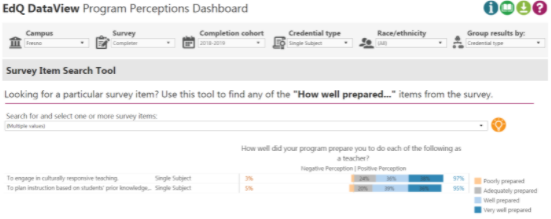
Figure 6. 2019-2020 CSU Educator Quality Center Completer Responses for Items Related to Culturally
Responsive Teaching (n=160)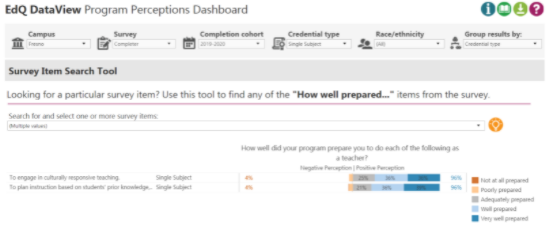
Link to Full Dataset:
Reviewers: If you would like to view the CSU Educator Quality Center Data Dashboards, we are happy to set up a time to provide access by sharing screens in a Zoom session.
Interpretation of Data:
The 2017-2018 EdQ completer surveys (Figure 4), reported on the findings from 183 student responses to the items directly tied
to aspect 1C. Of these, 96% of respondents indicated an overall positive perception
responding to the item gauging how well prepared they felt “to engage in culturally responsive teaching. This included 35.50% (n=65) indicating they were “very well prepared,” 31.20% (n=58)
indicating “well prepared,” and 28.30% (n=52) indicating adequately prepared. Secondly,
95% of respondents indicated an overall positive perception responding to the item
gauging how well prepared they were “to plan instruction based students prior knowledge,
academic readiness, language proficiency, cultural background, and individual development.
This included 38.80% (n=71) indicating they were “very well prepared,” 30.60% (n=56)
indicating “well prepared,” and 25.10% (n=46) indicating adequately prepared.
The 2018-2019 EdQ completer surveys (Figure 5), reported on the findings from 178 student responses to the items directly tied to aspect 1C. Of these, 97% of respondents indicated an overall positive perception responding to the item gauging how well prepared they felt “to engage in culturally responsive teaching. This included 37.90% (n=67) indicating they were “very well prepared,” 35.60% (n=63) indicating “well prepared,” and 23.70% (n=42) indicating adequately prepared. Secondly, 95% of respondents indicated an overall positive perception responding to the item gauging how well prepared they felt “to plan instruction based students prior knowledge, academic readiness, language proficiency, cultural background, and individual development. This included 36.00% (n=64) indicating they were “very well prepared,” 38.80% (n=69) indicating “well prepared,” and 20.20% (n=36) indicating adequately prepared.
The 2019-2020 EdQ completer surveys (Figure 6), reported on the findings from 160 student responses to the items directly tied to aspect 1C. Of these, 96% of respondents indicated an overall positive perception responding to the item gauging how well prepared they felt “to engage in culturally responsive teaching. This included 35.80% (n=57) indicating they felt “very well prepared,” 35.80% (n=57) indicating “well prepared,” and 24.50% (n=39) indicating adequately prepared. Secondly, 96% of respondents indicated an overall positive perception responding to the item gauging how well prepared they were “to plan instruction based students prior knowledge, academic readiness, language proficiency, cultural background, and individual development. This included 39.40% (n=63) indicating they were “very well prepared,” 35.60% (n=57) indicating “well prepared,” and 20.60% (n=33) indicating adequately prepared.
Next Steps:
Taken together, the three data sources show that our Single Subject Teaching Credential
Candidates are prepared and/or have met the expectations to understand culturally
responsive practices and understand the relative importance of the impact of language
acquisition and literacy development on learning. However, it is interesting to note
that the data does not disaggregate the intersectionality of race, ethnicity, class,
gender identity and expression, sexual identity. Another interesting factor is that
even though our credential candidates demonstrate a clear ability to provide culturally
responsive practices, there is no coursework or key assignment data to triangulate
this notion. In general, our candidates have performed well on the measures used as
evidence of meeting this aspect; however, these instruments alone do not fully reflect
the program’s ability to promote culturally responsive practices in secondary school
settings.
In order to address what we did find, the program will work to promote the disaggregation of data representing the intersectionality of race, ethnicity, class, gender identity and expression, sexual identity in the “student context” section of the TSP, and will work on gathering data from the courses that specifically address diversity and culturally responsive practices in our program curriculum. To evaluate our efforts, the program will review the collected data at our program meetings by specifically requiring that the use of these ideas be purposely reflected in our syllabi and our course assignments.