AAQEP Accreditation
Standard 1 Aspect D
Standard 1D: Evidence shows that, by the time of program completion, candidates exhibit knowledge, skills, and abilities of professional educators appropriate to their target credential or degree, including: Assessment of and for student learning, assessment and data literacy, and use of data to inform practice
Data Sources & Analysis
Data Source 1
Fresno Assessment of Student Teaching (FAST) - Teaching Sample Project (TSP)
Description of Data Source:
The Teaching Sample Project is one of two tasks in the Fresno Assessment of Student
Teachers (FAST) that collectively measure the pedagogical competence of teacher candidates
and interns for Preliminary Teaching Credentials in California, and as information
useful for determining program quality and effectiveness. To complete the TSP, candidates
are required: (a) to identify the context of their classroom (i.e. students and classroom
environment), (b) to plan and teach a series of at least five cohesive lessons (a
unit of study) with a focus on content knowledge and literacy, (c) to assess students’
learning before, during, and after the unit, (d) to document their teaching and their
students’ learning, and (e) reflect on the effectiveness of their teaching. The assessment
is scored using specific, task-focused rubrics. All coaches in the Ag Specialist program
are calibrated to score the assessment.
Perspective Captured from Data Source: University Coach
Rationale for Using Data Source:
In the Assessment Plan, candidates are asked to adapt or develop assessments to assist
in (a) planning the unit (pre assessments), (b) monitoring student progress (formative
assessments), and (c) measuring student learning (summative assessments). They are
then asked to provide a description and rationale of the assessments, scoring, and
evaluation criteria used for two of their learning outcomes.
In the Analysis of Student Learning, candidates are asked to analyze assessment data for evidence of students’ progress related to stated learning outcomes, then “Develop a unit progress report for a student who has struggled with instruction.”
We believe the evaluations of candidates’ efforts in each of these areas provide an excellent way to evaluate their knowledge of both how to plan meaningful assessments and then use their learning from those assessments to inform instruction.
Specific Elements of Data Source:
Teaching Sample Project rubric for Assessment Plan (TPE 4.3, 5.2, 5.1)
Overall score for Three Areas:
- Congruence with Learning Outcomes and Content
- Variety in Methods of Assessment
- Clarity of Assessment Methods
Teaching Sample Project rubric for Analysis of Student Learning (TPE 5.2, 5.5)
Overall score for Two Areas:
- Analysis and Interpretation of Data
- Progress Report
Definition of Success for Each Element:
Programmatically, our goal is for all candidates to score at least a 2.0 (out of
4.0) by their completion of their fieldwork experience
Displays of Analyzed Data:
Table 1. Statistical summaries of student rubric scores for TSP Section 3: Assessment
Plan & Section 6: Analysis of Student Learning
| - | Spring 2019 | Fall 2019 | Spring 2020 |
|---|---|---|---|
| Number of candidates | 123 | 45 | 120 |
| Assessment Plan | |||
| Mean Rubric Score (Attempt 1) | 2.54 | 2.44 | 2.73 |
| Standard Deviation (Attempt 1) | 0.72 | 0.62 | 0.74 |
| Students Passing Attempt 1 | 120 | 31 | 117 |
| % Passing Attempt 1 | 97.56% | 68.89% | 97.50% |
| Analysis of Student Learning | |||
| Mean Rubric Score (Attempt 1) | 2.58 | 2.60 | 2.59 |
| Standard Deviation (Attempt 1) | 0.76 | 0.62 | 0.77 |
| Students Passing Attempt 1 | 118 | 45 | 117 |
| % Passing Attempt 1 | 95.93% | 100.00% | 97.50% |
Link to Full Dataset:
Interpretation of Data:
As shown in Table 1, we found that programmatically, our candidates were rated as passing (i.e. achieving
a rubric score of 2 or higher) at a rate of 97.56% in Spring 2019, 68.89% in Fall
2019, and 97.50% in Spring 2020. Overall, this suggests to us that, in general, the
majority of our students are rated as well-prepared to address issues of assessment
planning. We present the passing rates for students across “first attempts” because
not all students attempted to take the FAST multiple times. The drop in scores for
Fall 2019 reflects the transition or reporting data management system for the program,
with fewer individuals submitting results due to the lack of data program accessibility.
With regard to candidates’ ability to analyze student learning based on their performance on the assessments, as addressed in Table 1, we found that, programmatically, candidates were rated as passing at a rate of 95.93% in Spring 2019, 100.00% in Fall 2019, and 97.5% in Spring 2020 across all attempts at the TSP. These percentages are fairly consistent across cycles of data, suggesting that the majority of our candidates are being prepared to adequately meet the standards of credentialing for analyzing student data.
What these trends suggest to us is that, in general, the program overall may be adequately preparing teacher-candidates in the areas of “Assessment of and for student learning, assessment and data literacy, and use of data to inform practice.” While these patterns offer some ideas about our program’s own areas of growth, additional sources of evidence should be considered in order to develop a more thorough picture of student progress and program evaluation.
Data Source 2
CSU Educator Quality Center Completer Survey
Description of Data Source:
Each year, the CSU Educator Quality Center (EdQ) administers a survey to program completers
to learn their perceptions of how well the program prepared them in a number of areas
aligned with the California Commission on Teacher Credentialing’s Teaching Performance
Expectations (TPE). Program completers from all CSU campuses are invited to respond
to each item on a 1-5 scale, where 1 indicates they believed that they were “not at
all” prepared and 5 indicates they believe they were “very well” prepared.”
Perspective Captured from Data Source: Completer
Rationale for using Data Source:
CSU Educator Quality Center Completer Survey captures program completers’ anonymous
perspectives of how well the program prepared them at the conclusion of their teaching
credential coursework and field experiences, providing valuable insights into their
perceptions of the program.
Specific Elements of Data Source:
Items used from the EdQ Program Completer Survey include:
How well did your program prepare you to do each of the following as a teacher:
- To use data from student assessments to inform instruction
- Understand and use assessment data from a variety of sources to establish learning goals and to plan, differentiate, and modify instructions
- Involve all students in self-assessment, goal setting, and monitoring progress
Definition of Success for Each Element: Programmatically, our goal is for all candidates to say they were either “well,” or “very well” prepared once they exit the program.
Displays of Analyzed Data:
Figure 1. 2017-2018 CSU Educator Quality Center Completer Responses for Items Related to Assessment
(n=182)
Figure 2. 2018-2019 CSU Educator Quality Center Completer Responses for Items Related to Assessment
(n=178) 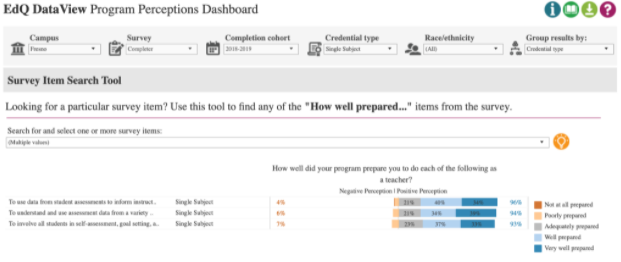
Figure 3. 2019-2020 CSU Educator Quality Center Completer Responses for Items Related to Assessment
(n=160)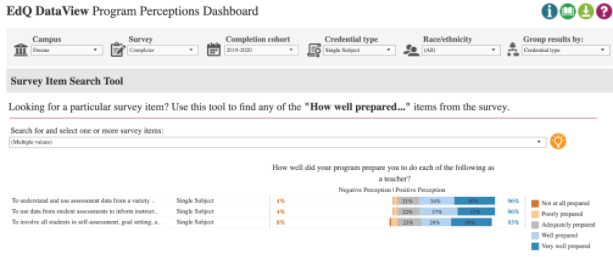
Link to Full Dataset:
Reviewers: If you would like to view the CSU Educator Quality Center Data Dashboards, we are happy to set up a time to provide access by sharing screens in a Zoom session.
Interpretation of Data:
For the 2017-2018, CSU Educator Quality Center completer survey (Figure 1), we report on the findings from 182 student responses to the items directly tied
to the Assessment Teaching Performance Expectations (TPEs). Of these, 97% of respondents
indicated an overall positive perception responding to the item gauging how well prepared
they felt “To understand and use assessment data from a variety of sources to establish
learning goals and to plan, differentiate, and modify instruction.” This included
36.3% (n=66) indicating they felt “very well prepared,” 36.8% (n=67) indicating “well
prepared,” and 24.2% (n=44) indicating adequately prepared. 94% of respondents indicated
an overall positive perception responding to the item gauging how well prepared they
felt “To use data from student assessments to inform instruction.” This included 38.8%
(n=71) indicating they felt “very well prepared,” 31.1% (n=57) indicating “well prepared,”
and 24% (n=44) indicating adequately prepared. Lastly, 92% of respondents indicated
an overall positive perception responding to the item gauging how well prepared they
felt “To involve students in self-assessment, goals setting and monitoring progress.”
This included 30.6% (n=56) indicating they felt “very well prepared,” 33.3% (n=61)
indicating “well prepared,” and 27.9% (n=51) indicating adequately prepared. Across
all three items, we interpret these findings as indications that the large majority
of completers felt at least adequately prepared in these areas of assessment.
For the 2018-2019 CSU Educator Quality Center completer survey (Figure 2), we report on the findings from 178 student responses to the items directly tied to the Assessment TPE. Of these, 96% of respondents indicated an overall positive perception responding to the item gauging how well prepared they felt “To understand and use assessment data from a variety of sources to establish learning goals and to plan, differentiate, and modify instruction.” This included 34.3% (n=61) indicating they felt “very well prepared,” 39.7% (n=71) indicating “well prepared,” and 21.3% (n=38) indicating adequately prepared. 94% of respondents indicated an overall positive perception responding to the item gauging how well prepared they felt “To use data from student assessments to inform instruction.” This included 39.3% (n=70) indicating they felt “very well prepared,” 33.7% (n=60) indicating “well prepared,” and 21.3% (n=38) indicating adequately prepared. Lastly, 93% of respondents indicated an overall positive perception responding to the item gauging how well prepared they felt “To involve students in self-assessment, goals setting and monitoring progress.” This included 33.3% (n=59) indicating they felt “very well prepared,” 36.7% (n=65) indicating “well prepared,” and 23.2% (n=41) indicating adequately prepared. Across all three items, we interpret these findings as indications that the large majority of completers felt at least adequately prepared in these areas of assessment.
For the 2019-2020 CSU Educator Quality Center (Figure 3), we report on the findings from 160 student responses to the items directly tied to the Assessment TPAs. Of these, 96% of respondents indicated an overall positive perception responding to the item gauging how well prepared they felt “To understand and use assessment data from a variety of sources to establish learning goals and to plan, differentiate, and modify instruction.” This included 40% (n=64) indicating they felt “very well prepared,” 34.4% (n=55) indicating “well prepared,” and 21.3% (n=34) indicating adequately prepared. 96% of respondents indicated an overall positive perception responding to the item gauging how well prepared they felt “To use data from student assessments to inform instruction.” This included 36.9% (n=59) indicating they felt “very well prepared,” 36.9% (n=59) indicating “well prepared,” and 21.9% (n=35) indicating adequately prepared. Lastly, 93% of respondents indicated an overall positive perception responding to the item gauging how well prepared they felt “To involve students in self-assessment, goals setting and monitoring progress.” This included 40% (n=64) indicating they felt “very well prepared,” 29.4% (n=47) indicating “well prepared,” and 23.1% (n=37) indicating adequately prepared. Across all three items, we interpret these findings as indications that the large majority of candidates felt at least adequate prepared in these areas of assessment.
Next Steps:
Overall, program completers indicated they are well-prepared to understand assessment
data, use assessment data to inform practice, and to involve students in self-assessments,
goal setting, and monitoring progress. Data from the Teaching Sample Project generally
aligns with the student responses, though areas of improvement are always important
to consider.
In order to address what we found, we will discuss the possibility of developing a course focused on using data and assessment to inform instruction or developing specific course modules to address using data and assessment in teaching. The program intends to integrate this idea into the initial and final student teaching seminars. Additionally, we will work with coaches scoring the TSP to understand the specific areas of the TSP where the completers are not meeting the desired level of success. To evaluate our efforts in this area, we will continue collecting and analyzing TSP and EdQ completer survey data on an annual basis.