AAQEP Accreditation
Standard 2: Aspect C
Standard 2c: Program completers engage in professional practice in educational settings and show that they have the skills and abilities to do so in a variety of additional settings and community/cultural contexts. For example, candidates must have broad and general knowledge of the impact of culture and language on learning, yet they cannot, within the context of any given program, experience working with the entire diversity of student identities, or in all types of school environments.
Candidate preparation includes first-hand professional experience accompanied by reflection that prepares candidates to engage effectively in different contexts they may encounter throughout their careers.
Case for Standard 2c:
For this aspect we chose three data sources to examine our work preparing teacher
candidates who can create productive learning environments: the Educator Quality Center
(EdQ), Course Grades for SPED 145: Designing Effective Environments for Students with
Moderate to Severe Disabilities,” and an internal Program Completer survey.
Data Sources & Analysis
Data Source 1
CSU Educator Quality Center Program Completer Survey
Description of Data Source:
Each year, the CSU Educator Quality Center administers a survey to program completers
to learn their perceptions of how well the program prepared them in a number of areas
aligned with the California Commission on Teacher Credentialing’s Teaching Performance
Expectations (TPE). Program completers from all CSU campuses are invited to respond
to each item on a 1-5 scale, where 1 indicates they believed that they were “not at
all” prepared and 5 indicates they believe they were “very well” prepared.” Fresno
State has a high rate of completion due to the efforts of our credential analyst who
requires completion as part of the credential application process.
Perspective Captured from Data Source: Program Completers
Rationale for using Data Source:
CSU Educator Quality Center Completer Survey captures program completers’ anonymous
perspectives of how well the program prepared them at the conclusion of their teaching
credential coursework and field experiences, providing valuable insights into their
perceptions of the program.
The items ask completers to respond specifically to how well the program prepared them to create productive learning environments and use strategies to develop productive learning environments in a variety of school contexts.
Specific Elements of Data Source:
Candidate responses for: How well did your program prepare you to do each of the following
as a teacher?
- To create a productive learning environment with high expectations for all students
- To establish and maintain a safe and respectful learning environment for all students
- To use a variety of instructional methods
- To engage students in cooperative group work as well as independent learning.
Definition of Success for Each Element:
Our definition of success:
- 0% reporting in the “Not at all Prepared” category
- 10% or less in the “Poorly Prepared” category
- Overall positive ratings 90% or higher
Displays of Analyzed Data:
Table 1, CSU Completer Survey, Element 1, 2018-21
| Element 1: To create a productive learning environment with high expectations for all students | |||
|---|---|---|---|
| Year | 2018-2019 N=61 |
2019-2020 N=52 |
2020-2021 N=48 |
| Not at all | 0% | 0% | 0% |
| Poorly Prepared | 0% | 1.9% | 0% |
| Adequately Prepared | 26.2% | 23.1% | 20.8% |
| Well Prepared | 41% | 44.2% | 37.5% |
| Very Well Prepared | 32.8% | 30.8% | 41.7% |
| Overall Negative | 0% | 2% | 0% |
| Overall Positive | 100% | 98% | 100% |
Table 2, CSU Completer Survey, Element 2, 2018-21
| Element 2: To establish and maintain a safe and respectful learning environment for all students | |||
|---|---|---|---|
| Year | 2018-2019 N=61 |
2019-2020 N=51 |
2020-2021 N=48 |
| Not at all | 0% | 0% | 0% |
| Poorly Prepared | 1.6% | 2% | 0% |
| Adequately Prepared | 18% | 23.5% | 8.3% |
| Well Prepared | 44.3% | 41.2% | 37.5% |
| Very Well Prepared | 36.1% | 33.3% | 41.7% |
| Overall Negative | 2% | 2% | 0% |
| Overall Positive | 98% | 98% | 100% |
Table 3, CSU Completer Survey, Element 3, 2018-21
| Element 3: To use a variety of instructional methods | |||
|---|---|---|---|
| Year | 2018-2019 N=61 |
2019-2020 N=52 |
2020-2021 N=48 |
| Not at all | 0% | 0% | 0% |
| Poorly Prepared | 0% | 0% | 0% |
| Adequately Prepared | 19.7% | 25% | 18.8% |
| Well Prepared | 34.4% | 40.4% | 31.3% |
| Very Well Prepared | 45.9% | 34.6% | 50% |
| Overall Negative | 0% | 0% | 0% |
| Overall Positive | 100% | 100% | 100% |
Table 4, CSU Completer Survey, Element 4, 2018-21
| Element 4: To engage students in cooperative group work as well as independent learning. | |||
|---|---|---|---|
| Year | 2018-2019 N=66 |
2019-2020 N=56 |
2020-2021 N=52 |
| Not at all | 0% | 0% | 0% |
| Poorly Prepared | 3.0% | 1.8% | 1.9% |
| Adequately Prepared | 27.3% | 26.8% | 21.2% |
| Well Prepared | 37.9% | 46.4% | 34.6% |
| Very Well Prepared | 31.8% | 25% | 42.3% |
| Overall Negative | 3% | 2% | 2% |
| Overall Positive | 97% | 98% | 98% |
Link to Full Dataset: The link to the full dataset is unavailable. However, if reviewers would like to view the CSU Educator Quality Center Data Dashboards, we are happy to set up a time to provide them access by sharing screens in a Zoom session.
Interpretation of Data:
The number of respondents for 2018-2019 was 66, the number of respondents for 2019-2020
was 54, and the number of respondents for 2020-2021 was 48. Since our credential analyst
requires completers to fill out this survey as part of the credential application
process, these numbers indicate a decline in students completing education specialist
certifications.
This data provided a number of important insights. First, since the vast majority of these scores gave us over 80% in the “Well Prepared” and “Very Well Prepared” categories, the data demonstrate that we have a high level of effectiveness related to these four elements in the eyes of our completers. Moreover, although there were small percentages of responders who responded that they were “Not at All Prepared” or “Poorly Prepared” between 2018-20, for 2020-21, no one responded that they were “Not at All Prepared” and only 2% responded that they were “Poorly Prepared” to engage students in cooperative and independent work. We are pleased with these results.
The dip during the 2019-20 academic year may be partially explained by a shift to online instruction, including student teaching, during the Spring 2020 semester due to the pandemic. This might account for why some students felt that they were not adequately prepared to create productive learning environments. Certainly, that was a greater challenge for our teacher candidates as they shifted to online instruction. The stability of knowing that 2020-21 would be entirely online for students and the increasing familiarity of school sites with online instruction may account for a return to increasing scores.
The greatest area of concern for us is in relation to Element 4 about engaging students in cooperative and independent learning. The percentage of students who feel they were not well prepared stayed consistent, which indicates we need to further study what is happening with the small percentage of students who feel ill prepared in this area.
Data Source 2
SPED 145: Designing Effective Environments for Students with Moderate to Severe Disabilities Final Course Grades
Description of Data Source:
SPED 145 is designed to support special education teacher candidates in creating and
maintaining educational programs and environments that are supportive of students
with moderate to severe disabilities. This course is required of all special education
teacher candidates regardless of credential program (mild to moderate disabilities,
moderate to severe disabilities, dual special education/multiple subjects credentials).
Perspective Captured from Data Source: Program Faculty
Rationale for using Data Source:
The purpose of SPED 145: Designing Effective Environments for Students with Moderate
to Severe Disabilities is to prepare our teacher candidates for the inclusion of students
with moderate to severe disabilities within various educational settings (e.g., general
education classrooms). Course topics related to this aspect include: creating Universally
Designed Lessons (UDL) in addition to gaining familiarity with diversity and (dis)ability
awareness curricula and information-sharing strategies and utilizing in curricular
and other school contexts.
Specific Elements of Data Source: Final course grades
Definition of Success for Each Element:
Candidates are required to earn an A or a B in order to meet grade point average requirements
for the program.
Displays of Analyzed Data:
Figure 1, SPED 145, Final Course Grades, 2017-21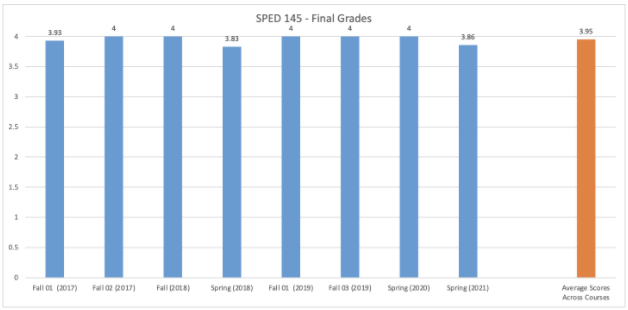
Link to Full Dataset: SPED 145 Final Grades Dataset
Interpretation of Data:
In calculating average GPA scores across eight (8) sections of SPED 145, student teacher
candidates in the educational specialist credential program mean scores were 3.95.
In addition, of all course sections analyzed, the lowest average class GPA was 3.8.
This data is promising as a passing grade in SPED 145 is a requirement of all teaching
candidates in the special education program.
Data Source 3
Program Completer Survey (Pilot)
Description of Data Source:
We realized that the data captured by some of the tools developed by the CSU Educator
Quality Center did not allow us to measure the progress of our completers with direct
questions about CLSP and community involvement. Thus, when we developed a pilot survey,
we specifically worked to solicit feedback from completers about these areas.
We reached out to graduates of the Education Specialist Credential Program (N=34) to measure the extent to which our graduates engage in various professional practices (e.g., collaboration with professionals, engaging in culturally and linguistically sustaining practices, involvement in community engagement). Candidates rated each item on a 4-point likert scale (1=none, 2=a little, 3=somewhat, 4=a lot).
The first two surveys, conducted in fall 2020 and spring 2021, resulted in thirty-four valid responses. Of the thirty-four respondents, one respondent completed the credential program in 2018, two respondents completed in 2019, seventeen respondents completed in 2020, and fourteen respondents in spring 2021.
Perspective Captured from Data Source: Completers
Rationale for Using Data Source:
Our pilot survey seeks to gather information from our completers in the specific area
of completers’ involvement in the creation of and use of strategies to develop productive
learning environments in a variety of school contexts.
Specific Elements of Data Source:
We analyzed completer responses to the survey item, “to what extent do you currently
engage in the creation of positive learning environments in a variety of school contexts?”
Definition of Success for Each Element:
Our goal is that 85% of our completers respond with either “A lot” or “Somewhat.”
Displays of Analyzed Data:
Figure 2, Program Completer Survey (Pilot), Positive Learning Environments, 2018-21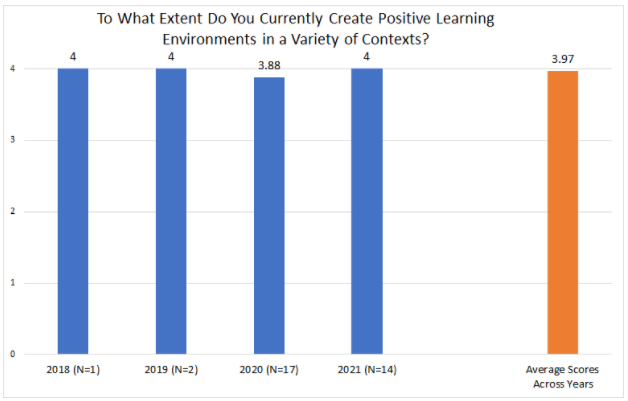
Link to Full Dataset: Program Survey Positive Learning Environments Dataset
Interpretation of Data:
In analyzing this data from graduates of the educational specialist program it is
not surprising that completers across all graduating years responded to the question,
“to what extent do you currently engage in the creation of positive learning environments
in a variety of school contexts?” with an average score of 3.97 (out of 4). Given
that the core responsibility of special education teachers is to provide their students
with positive support and the creation of positive learning environments, it is expected
that this response would be rated high.
Next Steps Narrative:
Overall, we were pleased with these results, which demonstrate that one of the strengths
of our program is preparing teacher candidates in the creation of positive learning
environments that are supportive of all students (including students with disabilities
and specific learning and behavioral needs). As the creation of positive learning
environments is at the core of special education teaching, we plan to continue to
measure the needs of our students that are unique to creating, implementing, and maintaining
positive learning environments in school settings and to monitor student feedback
that will help us as teacher educators to better support our program in this particular
area.
To evaluate our efforts in this area, we will continue to collect data from our student teacher candidates and in particular, we will include additional response items to identify the specific instructional opportunities that will further enhance our instruction and the development of our student teacher candidates in the creation of positive learning environments and instruction.