AAQEP Accreditation
Standard 2: Aspect A
Standard 2a: Program completers engage in professional practice in educational settings and show that they have the skills and abilities to do so in a variety of additional settings and community/cultural contexts. For example, candidates must have broad and general knowledge of the impact of culture and language on learning, yet they cannot, within the context of any given program, experience working with the entire diversity of student identities, or in all types of school environments.
Candidate preparation includes first-hand professional experience accompanied by the reflection that prepares candidates to engage effectively in different contexts they may encounter throughout their careers.
Data Sources & Analysis
Data Source 1
CSU Year One Completer Survey
Description of Data Source:
The California State University’s Education Quality Center (EdQ) oversees the administration
of a survey of all individuals who completed a CSU teacher-preparation program after
their first year on the job. The survey is administered annually April through July.
In April, the EdQ Center emails an initial survey invitation to all completers of
Multiple Subject Credential Programs serving as first-year teachers in public schools,
charter schools, or private schools in all locations. Follow-up reminders are sent
every two weeks throughout the duration of the survey window.
In addition to asking questions about the completer’s demographics and educational background, the survey also contains items to capture data about the school where the completer is employed. Additionally, the survey includes items asking about candidates’ perceptions of various aspects of the preparation program and the field placement experience. Campuses have access to annual results from the survey by utilizing the EdQ Dashboard. Results can be disaggregated by various measures including campus, year of completion, respondent race/ethnicity, and type of credential. Note: the CTC also distributes a Credential Program Completer Survey which gives an overall view of CA Educator Preparation Programs.
Perspective Captured from Data Source: Completer (one year after program completion)
Rationale for Using Data Source:
For candidates who completed a CSU educator preparation program each academic year
from 2014-2015 to 2017-2018, the CSU Educator Quality Center administered a year-out
survey to learn how well the educators, after their first year in the field, believed
the program had prepared them. Due to the challenges of educators in Spring 2020,
the CSU Educator Quality chose not to administer the survey at that time, meaning
data are not available for candidates who completed in 2018-2019. Survey administration
began again in Spring 2021, and we look forward to analyzing those data when they
become available.
Even so, the routine, annual collection of these data offers the program a look at Multiple Subject Program Completer perceptions of preparedness longitudinally. Moreover, the survey items are also aligned to the Teaching Performance Expectations to which our program curriculum and clinical experiences are also aligned. This makes the survey a good tool for the face validity of the survey as it measures what our program intends to understand about the quality of our teacher credential program. Overall this survey tool aims to capture completers’ perceptions of preparation after having been a teacher of record for one year.
We selected three (3) items from the survey that focused on the Multiple Subject Program Completers’ (MSPC) one-year out perspectives of how the program prepared them to establish strong partnerships with families/guardians/caregivers.
Specific Elements of Data Source:
The items we selected to analyze include candidate responses for “how well prepared
were you to begin . . .” each aspect of a teacher’s job listed below:
- To collaborate with specialists and parents in the education of students with special needs.
- To communicate effectively with the parents and families of ELs.
- To communicate effectively with the parents or guardians of my students.
Definition of Success for Each Element:
On each item, candidates have the following five Likert-response options: 1 -Not at all Prepared, 2 -Poorly Prepared, 3 -Adequately Prepared, 4 -Well Prepared,
5 -Very Well Prepared, in order to indicate their perception of their preparation.
It is our program's goal to have 75% or more of candidates indicate positive preparedness perceptions within the 3 - 5 range or from “Adequately Prepared” to “Well Prepared” to “Very Well Prepared.”
Displays of Analyzed Data:
Figure 1: 2015-2016 Multiple Subject Program Completers One Year Out (N 44)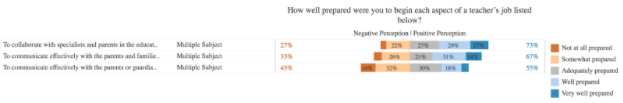
Figure 2: 2016-2017 Multiple Subject Program Completers One Year Out (N 61)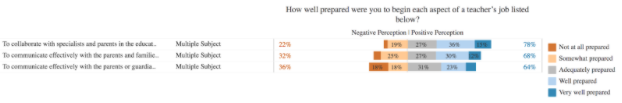
Figure 3: 2017-2018 Multiple Subject Program Completers One Year Out (N 59)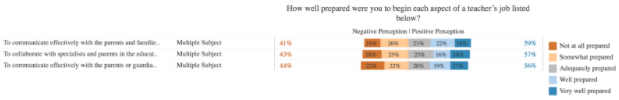
Link to Full Dataset: The link to the full dataset is unavailable. However, if reviewers would like to view the CSU Educator Quality Center Data Dashboards, we are happy to set up a time to provide them access by sharing screens in a Zoom session.
Interpretation of Data:
The data collected over these three years show a consistent trend that most of our
candidates after being a teacher for one year did not feel well prepared to foster
relationships with families/guardians/caregivers. All but one item in 2016-2017 fell
below 75% program benchmark goal of positive perception over the past three years.
The program completers one year out felt ready to collaborate with specialists and
parents in the education of students with special needs most consistently. The area
that requires the most improvement for our program is in providing teacher candidates
with strategies and experiences that help them learn how to communicate effectively
with the parents or guardians of my students.
Data Source 2
Formative & Summative Induction Evaluation
Description of Data Source:
Fresno Unified is the third-largest school district in California, educating just
over 73,000 K-12 students in the 2019-2020 academic year (CDE, n.d.). Of those students, 68% identified as Latinx, 10% identified as Asian, 9% identified
as White, 8% identified as Black, and 2% identified with two or more races, and 60%
of those children are dual-language learners (CDE Dataquest, n.d.). Additionally, 85.9% of the students in the local school district receive free
or reduced meals (CDE, n.d.). Fresno Unified also consistently places the largest number of Multiple Subject
Credential Candidates with experienced mentor teachers in their district for their
clinical experience (N 73; 26%). Moreover, Fresno Unified hires the majority of our MS program completers; 60-70
new hires each year. For these reasons, we launched a plan in March 2020 where Fresno
Unified agreed to strengthen their data collection systems so that we could receive
their teacher induction program data.
Perspective Captured from Data Source: Fresno Unified School District Instructional Coach
Rationale for Using Data Source:
The Formative & Summative New Teacher Evaluation is recognized as a desirable method
to achieve the improvement of instruction, to identify skills and abilities that contribute
to the success of the educational program, and to redirect skills and abilities that
do not result in optimum student growth. The goals of the evaluation are as follows:
- To recognize the performance of outstanding employees
- To enhance and improve performance through communications that is direct, clear, honest, immediate, frequent, and evidence based
- To align professional growth to employees’ strengths and areas of improvement
- To provide avenues for informal and formal communications that build relationships.
District Instructional Coaches are trained and calibrated to use the district’s formative and summative evaluation rubric that is aligned with the California Standards for the Teaching Profession (CSTP), which is also aligned with the Teaching Performance Expectations that serve as a guide to our program’s curriculum and clinical experiences. New teachers are formally observed twice per year. The first formal observation takes place by the end of November and it is formative in nature. A full lesson is observed and followed up by a debrief within five days from the observation. The second formal observation takes place by the end of May and it is summative in nature.
Specific Elements of Data Source:
The items we selected to analyze align to TPE/CSTP 6: Developing as a Professional
Educator because this Standard also assesses how teachers work with families to support
student learning. The Standard asks teachers to consider how and why they:
- Value and respect students’ families and appreciate their role in student learning.
- Develop an understanding of families’ racial, cultural, linguistic, and socioeconomic background
Definition of Success for Each Element:
The Formative and Summative New Teacher Evaluation consists of a scale of 1-4:
1 - “Does Not Meet Standards”
2 - “Growth Expected”
3 - “Meeting Standards”
4 - “Demonstrates Expertise”
A 2 of “Growth Expected” still meets the goals of the CSTP measured by the rubric. It is our program's goal to have 85% or more of the program’s completers in their first year of hire within the 3 - 4 range or “Meeting Standards” to “Demonstrates Expertise” by the summative evaluation. Our program would also want to observe an increase in completers’ scores from the formative to summative evaluation.
Displays of Analyzed Data:
Table 1: 2020-2021 Formative and Summative Outcomes on CSTP 6
| Score | CSTP 6 Formative (N 65) | CSTP 6 Summative (N 66) |
|---|---|---|
| Demonstrates Expertise | 2% | 0% |
| Meeting Standards | 95% | 95% |
| Growth Expected | 3% | 5% |
| Does Not Meet Standards | 0% | 0% |
Link to Full Dataset: FUSD Fresno State Induction Data
Interpretation of Data:
The data collected over the past year indicates that 95% of program’s completers
in their first year of hire are Meeting Standards or higher on CSTP 6 for their summative
evaluation thereby meeting the program’s goal for new teachers working with families
to support student learning. A slight decrease in performance occurred from the formative
to summative evaluations, which fell short of our secondary program goal.
Data Source 3
Fresno Assessment of Student Teachers II (FAST II): Teaching Sample Project
Description of Data Source:
The FAST is a Teaching Performance Assessment system designed specifically for use
in the teacher preparation program in Kremen School of Education and Human Development
at California State University, Fresno. The FAST instrument assesses the pedagogical
competence of teacher candidates with regard to the Teaching Performance Expectations
(TPE’s).
Although the FAST was originally developed and implemented about sixteen years ago, it has recently been modified to align with the revised assessment standards from California Commission on Teaching Credentialing (CCTC). Our Multiple Subject Program was also being revised at the same time to align with the new Teaching Performance Expectations. The revised assessment was piloted during the Fall 2017/Spring 2018 academic year and was approved by the California Department of Education in August 2018.
FAST II consists of two projects: the Site Visitation Project (SVP) is completed during initial student teaching (EHD 178) and the Teaching Sample Project (TSP) is completed during final student teaching (EHD 170). The Teaching Sample Project assesses teacher candidates’ ability to (a) identify the context of the classroom, (b) plan and teach a series of at least five cohesive lessons with a focus on content knowledge and literacy, (c) assess students’ learning related to the unit, (d) document their teaching and their students’ learning, and (e) reflect on the effectiveness of their teaching. Teacher candidates document how they are addressing the needs of all their students in the planning, teaching, and assessing of the content.
Perspective Captured from Data Source: Program Faculty and University Coaches
Rationale for Using Data Source:
The Teaching Sample Project (TSP) is one of two tasks in the Fresno Assessment of
Student Teachers (FAST) that collectively measure the pedagogical competence of teacher
candidates and interns for Preliminary Teaching Credentials in California and serve
as information useful for determining program quality and effectiveness. Candidates
complete the TSP during the final phase of the program. To complete the TSP, candidates
identify the classroom context (i.e. students and classroom environment), plan and
teach a series of at least 5 cohesive lessons (a unit of study) with a focus on content
knowledge and literacy, assess students’ learning before, during, and after the unit,
and reflect on the effectiveness of the instruction.
The overall assignment is scored using a rubric. For the purposes of determining whether or not our candidates exhibit knowledge of how to foster relationships with families/guardians/caregivers in a variety of communities, we chose to focus on the rubric dimension “Analysis of Student Learning.” In this section, candidates need to develop a progress report for a student who struggled during the unit of instruction. Candidates use data and examples to describe strengths and areas for growth related to the unit outcomes. They must also provide suggestions for improving student learning. Candidates also write a letter to the family of the student who was struggling to convey this information and enlist their support in advancing the student’s learning and development.
Specific Elements of Data Source:
We chose to focus on the rubric dimension “Analysis of Student Learning.” See Figure
4.
Figure 4: FAST Teaching Sample Project Rubric, Analysis of Student Learning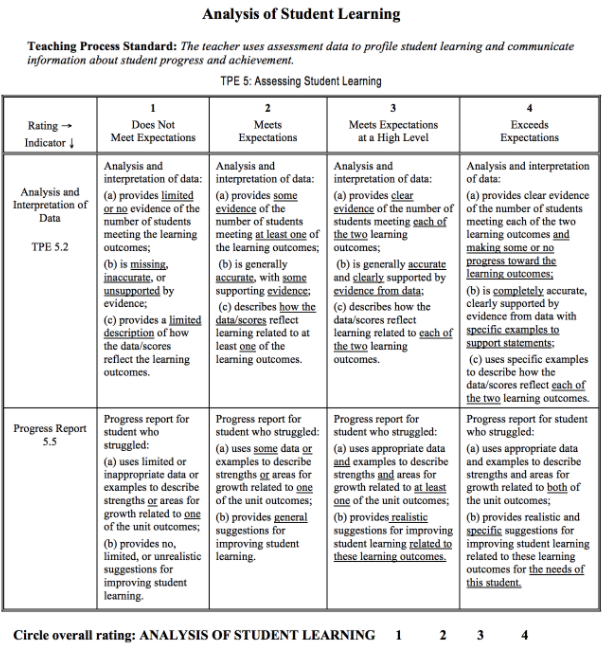
Definition of Success for Each Element:
Multiple Subject teacher candidates must score a 2 out of 4 on each of the rubrics
of the TSP in order to achieve a passing score. Our program goal is that our teacher
candidates score at least a 3 on each component of the TSP.
Displays of Analyzed Data:
Table 2: Teaching Sample Distribution of Scores for Analysis of Student Learning
| Semester | Score 1 | Score 2 | Score 3 | Score 4 | Average Score |
|---|---|---|---|---|---|
| Fall 2018 (n=94) |
6% | 47% | 44% | 3% | 2.5 |
| Spring 2019 (n = 98) |
6% | 44% | 41% | 9% | 2.5 |
| Fall 2019 (n = 129) |
5% | 32% | 48% | 15% | 2.7 |
| Spring 2020 (n = 52) |
3% | 53% | 39% | 5% | 2.5 |
Link to Full Dataset: MS FAST Scores TSP
Interpretation of Data:
Data is presented for the Teaching Sample Project- Analysis of Student Learning component
for the previous four semesters. The data illustrates that upon program completion
candidates demonstrate strong abilities to use data to develop a program report for
a student and share that information in an accessible way with families. Consistently
over 96% of candidates earn a passing score on this component.
Next Steps:
Focus: Need to address the program completers’ ability to communicate orally with
parents/guardians in an effective manner.
In order to address what we found, we will . . .
- Invite program faculty and district partners into conversations about how we prepare program completers to be day one ready to work collaboratively with families to support student learning.
Work together to reflect on…
What does this look like in practice? How can we build in more clinical experiences that build new teacher confidence in working with families? What change ideas can we test out and study? Review data together and discuss what additional data is needed to help us develop interpretations that increase our confidence and decision-making.
To evaluate our efforts in this area, we will . . .
- Strengthen the datasets that we currently have to assess this area:
- Invite two more district partners to support data sharing of induction data including discussing their induction practices and data collection procedures.
- Ask Fresno Unified about receiving induction data by item-level analysis and for program completers by year of service in the district (Year 1, Year 2, Year 3 and Year 5).
- Work with our district partners to develop a strategy to increase CCTC employer survey response rates.