AAQEP Accreditation
Standard 2 Aspect D
Standard 2: Program completers engage in professional practice in educational settings and show that they have the skills and abilities to do so in a variety of additional settings and community/cultural contexts. For example, candidates must have broad and general knowledge of the impact of culture and language on learning, yet they cannot, within the context of any given program, experience working with the entire diversity of student identities, or in all types of school environments.
Candidate preparation includes first-hand professional experience accompanied by reflection that prepares candidates to engage effectively in different contexts they may encounter throughout their careers.
Data Sources & Analysis
Data Source 1
CSU Educator Quality Center Employer Survey
Definition of Data Source:
The CSU Educator Quality Center administered a survey to employers of 2014-2015 and
2015-2016 graduates of CSU educator preparation programs. Results were able to be
disaggregated by both preparatory institution and program. The survey was discontinued
after evaluating the 2015-2016 completers, meaning that all available data are at
least five years old. The California Commission on Teacher Credentialing (CCTC) began
its own employer survey that it first administered in Fall 2019. However, while it
is possible to disaggregate results by institution, it is not possible to do so by
preparation program. In the future, we plan to advocate to the CCTC for the addition
of items to the survey that would allow data to be disaggregated in this way.
Although the data from the CSU Employer Survey are dated, we chose to use the results anyway as one of our three data sources because they do provide an employer perspective on our candidates. Additionally, the results provide us with a baseline to which we can compare results collected in the future.
Employers are invited to respond to each item on a 1-5 scale to indicate their perception of the completers’ level of preparation, with 1 indicating not at all prepared, 2 indicating poorly prepared; 3 indicating adequately prepared; 4 indicating well prepared and 5 indicating very well prepared.
Perspective Captured from Data Source: Employer
Specific Elements of Data Source:
CSU Educator Quality Center Employer Survey items selected to evaluate employers’
perceptions of completers’ ability to support growth in international and global perspectives
purposely include:
How well prepared was the teacher:
- to build students' awareness and appreciation of cultural diversity in our society, and
- to help students connect classroom learning to life outside of school.
Definition of Success for Each Element: Programmatically, our goal is that employers of our completers will indicate the teachers were either “well,” or “very well” prepared in each area.
Displays of Analyzed Data
Figure 1. CSU Educator Quality Center Employer responses items related to 2014-2015 program
completers’ ability to support students’ growth in international and global perspectives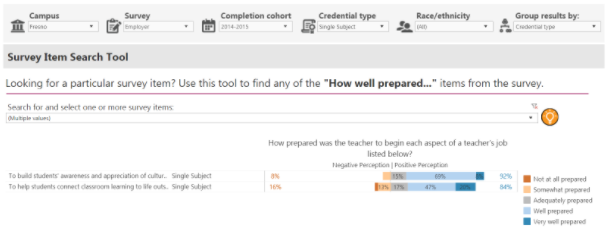
Figure 2. CSU Educator Quality Center Employer responses items related to 2015-2016 program
completers’ ability to support students’ growth in international and global perspectives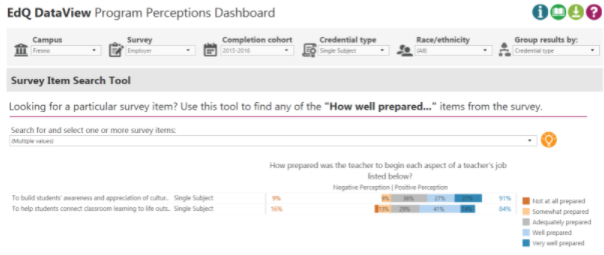
Link to Full Dataset: The link to the full dataset is unavailable. However, if reviewers would like to view the CSU Educator Quality Center Data Dashboards, we are happy to set up a time to provide them access by sharing screens in a Zoom session.
Interpretation of Data:
For the CSU Educator Quality Center survey evaluating the preparedness of completers
from the 2014-2015 cohort of candidates (Figure 1), 92% of the 13 employers who responded
indicated an overall positive perception in gauging how well prepared our completers
were to “build students' awareness and appreciation of cultural diversity in our society.” This included 7.70% (n=1) indicating they felt our completers were “very well prepared,”
69.20% (n=9) indicating our completers were “well prepared,” and 15.40% (n=2) indicated
our completers were “adequately prepared.” Similarly, 84% of the 64 employers who
responded to the items that asked about how well prepared our completers were to “help students connect classroom learning to life outside of school” indicated an overall positive perception. This included 21.90% (n=14) indicating
they felt our completer were “very well prepared,” 45.30% (n=29) indicating they were
“well prepared,” and 17.20% (n=11) indicating they were adequately prepared.
For the CSU Educator Quality Center survey evaluating the preparedness of completers from the 2015-2016 cohort of candidates (Figure 2), 91% of the 11 employers who responded indicated an overall positive perception in gauging how well prepared our completers were to “build students' awareness and appreciation of cultural diversity in our society.” This included 27.70% (n=3) indicating our completers were “very well prepared,” 27.70% (n=3) indicating our completers were “well prepared,” and 36.40% (n=4) indicating our completers were “adequately prepared.” Similarly, 84% of the 56 employers who responded to the items that asked about how well prepared our completers were to “help students connect classroom learning to life outside of school” indicated an overall positive perception. This included 14.30% (n=8) indicating our candidates were “very well prepared,” 41.10% (n=23) indicating they were “well prepared,” and 28.60% (n=16) indicating they were adequately prepared.
Data Source 2
CCTC Program Completer Survey
Description of Data Source:
The California Commission on Teacher Credentialing administers a survey annually to
all individuals in the state when they apply for a credential. The survey seeks to
collect candidates’ perceptions of their preparation program and is organized under
the six domains of the Teaching Performance Expectations (TPEs).
CCTC Program Completers responded to each survey item on a 1-5 scale, with 1 indicating “not at all” prepared, 2 indicating “poorly” prepared; 3 indicating “adequately” prepared; 4 indicating “well” prepared, and 5 indicating “very well” prepared.
Perspective Captured from Data Source: Program Completer
Rationale for using Data Source:
Although the survey gathers data from candidates at the time they complete the program,
we believe that their perceptions of the program at this point help us to know if
they feel ready to support students’ growth in international and global perspectives.
Specific Elements of the Data Source:
As program candidates engage in the preparation of their own students' thinking, they
are also perpetuating their international and global perspectives by giving their
students the skills to solve problems, think critically, and find ways to build collaboration
at a local and global level. As a result the following items from the CCTC Program
Completer Survey were selected:
How well did your preparation program prepare you to:
- Engage students in inquiry, problem solving, and reflection to promote critical thinking;
- Connect classroom learning to the real world.
Definition of Success for Each Element:
Programmatically, our goal is for our candidates to indicate they were either well
or very well prepared after completing the program.
Table 1. Responses to CCTC Completer Survey items related to supporting students’ growth in global and international perspectives (Full Dataset)
| Rating | 2016-2017 (n=81) |
2017-2018 (n=186) |
2018-2019 (n=176) |
2019-2020 (n=161) |
|---|---|---|---|---|
| Engage students in inquiry, problem solving, and reflection to promote their critical thinking | ||||
| Not at all | 0 (0%) | 1 (0.5%) | 0 (0%) | 0 (0%) |
| Poorly | 1 (1.2%) | 7 (3.8%) | 3 (1.7%) | 6 (3.7%) |
| Adequately | 17 (21.0%) | 41 (22.0%) | 39 (22.2%) | 33 (20.5%) |
| Well | 29 (35.8%) | 64 (34.4%) | 64 (36.4%) | 64 (39.8%) |
| Very well | 34 (42.0%) | 73 (39.2%) | 70 (39.8%) | 58 (36.0%) |
| Connect classroom learning to the real world | ||||
| Not at all | 0 (0%) | 1 (0.5%) | 1 (0.6%) | 0 (0%) |
| Poorly | 3 (3.7%) | 9 (4.8%) | 7 (4.0%) | 6 (3.6%) |
| Adequately | 18 (22.2%) | 42 (22.3%) | 36 (20.3%) | 35 (21.2%) |
| Well | 25 (30.9%) | 56 (29.8%) | 61 (34.5%) | 58 (35.2%) |
| Very well | 35 (43.2%) | 80 (42.6%) | 72 (40.7%) | 66 (40%) |
Interpretation:
Examining the responses to the two responses selected to evaluate completers’ perception
of how well prepared they were to support students’ growth in international and global
perspectives. Across both items, at least two-thirds of responding completers each
year indicated they were well or very well prepared to engage students in inquiry,
problem solving, and reflection to promote their critical thinking and to connect
classroom learning to the real world, both areas we believe help support students’
understand of the greater world in which they live.
Still, it is worth noting that, across all four years of data collection, at least 20% of respondents indicated they were only adequately prepared in each area. The program may want to investigate each of these areas further in the future through other means, such as a focus group with program completers.
Data Source 3
CSU Educator Quality Center Year One Teacher Survey
Description of Data Source:
For candidates who completed a CSU educator preparation program each academic year
from 2014-2015 to 2017-2018, the CSU Educator Quality Center administered a year-out
survey to learn how well the educators, after their first year in the field, believed
the program had prepared them. Year One Teachers respond to each item on a 1-5 scale,
where 1 indicates they were not at all prepared, 2 indicates they were poorly prepared;
3 indicates they were adequately prepared; 4 indicates they were well prepared and
5 indicates they were very well prepared.
Due to the challenges of educators in Spring 2020, the CSU Educator Quality chose not to administer the survey at that time, meaning data are not available for candidates who completed in 2018-2019. Survey administration began again in Spring 2021, and we look forward to analyzing those data when they become available.
Perspective Captured from Data Source: Year One Teacher
Rationale for using Data Source:
The CSU Educator Quality Center survey captures the perspectives of program completers
after their first year of teaching. Items on the survey invite candidates to share
how well they believe the program prepared them in several key areas.
Specific Elements of Data Source:
As program candidates develop the social and emotional competence in children as well
as student’s critical thinking, they are also perpetuating their own international
and global perspectives as this requires social and emotional empathy towards others,
as a result the following items from the CSU Educator Quality Center Year One Teacher
Survey were purposely selected to evaluate whether or not teachers who completed our
program felt they were prepared to develop an international and global perspectives
among their students and within themselves:
How well prepared were you:
- to develop social and emotional competencies in children (e.g., empathy, motivation, self-regulation); and
- to develop students' critical thinking, problem solving and decision-making skills.
Data Measurement:
Responders to the survey are invited to respond to each item on a 1-5 scale with 1
indicating “not at all” prepared, ” 2 indicating “poorly” prepared; 3 indicating “adequately”
prepared; 4 indicating “well” prepared, and 5 indicating “very well” prepared.
Definition of Success for Each Element: Programmatically, our goal is for all candidates to say they were either “well,” or “very well” prepared one year-out once they exit the program.
Displays of Analyzed Data:
Figure 3. 2016-2017 Year One Teacher Survey Responses from 2015-2016 Completers (n=57) for
Program Perception Items Related to Creating Productive Learning Environments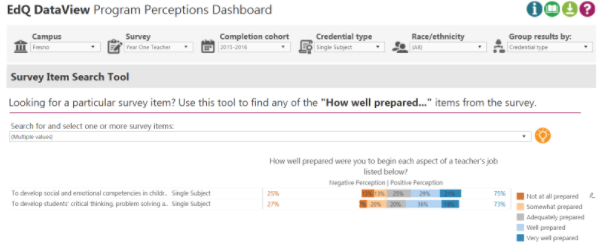
Figure 4. 2017-2018 Year One Teacher Survey Responses from 2016-2017 Completers (n=38) for
Program Perception Items Related to Creating Productive Learning Environments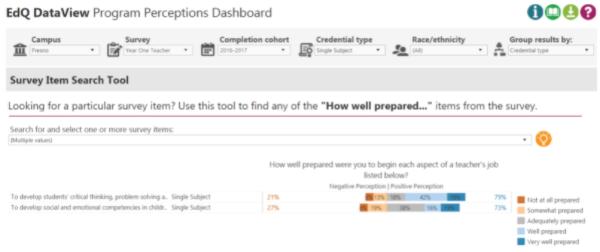
Figure 5. 2018-2019 Year One Teacher Survey Responses from 2017-2018 (n=51) Completers for Program
Perception Items Related to Creating Productive Learning Environments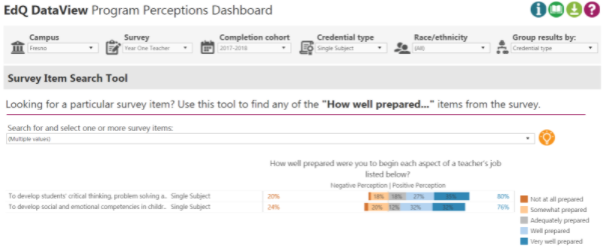
Link to Full Dataset: The link to the full dataset is unavailable. However, if reviewers would like to view the CSU Educator Quality Center Data Dashboards, we are happy to set up a time to provide them access by sharing screens in a Zoom session.
Interpretation of Data:
Looking across the responses from all three years, nearly three-quarters of responding
first-year teachers consisting indicated they were prepared in each area.
For the 2016-2017 survey of 2015-2016 program completers (Figure 3), we report on the findings completers’ responses related to students’ growth in international and global perspectives. Data collected from the first item, indicated that 75% felt “prepared” to To develop social and emotional competencies in children (e.g., empathy, motivation, self-regulation). Of these 56 respondents, 21.0% (n=12) rated themselves as “very well” prepared, 28.60% (n=16) felt “well prepared,” and 25% (n=14), marked themselves as “adequately” prepared. Data collected from the second item, showed that 73% felt “prepared” to develop students' critical thinking, problem solving and decision-making skills. Of these 56 respondents, 17.90% (n=10) rated themselves as “very well” prepared, 35.70% (n=20) felt “well prepared,” and 19.60% (n=11), marked themselves as “adequately” prepared.
For the 2017-2018 survey of 2016-2017 program completers (Figure 2), we report on the findings from Year One Teacher responses related to students’ growth in international and global perspectives. Data collected from the first item, indicated that 79% felt “prepared” to To develop social and emotional competencies in children (e.g., empathy, motivation, self-regulation) Of these 38 respondents, 18.90% (n=7) rated themselves as “very well” prepared, 16.20% (n=6) felt “well prepared,” and 37.80% (n=14), marked themselves as “adequately” prepared. Data collected from the second item, showed that 73% felt “prepared” to develop students' critical thinking, problem solving and decision-making skills. Of these 38 respondents, 18.40% (n=7) rated themselves as “very well” prepared, 42.10% (n=16) felt “well prepared,” and 18.40% (n=7), marked themselves as “adequately” prepared.
For the 2018-2019 survey of 2017-2018 program completers (Figure 3), we report on the findings from Year One Teacher responses related to students’ growth in international and global perspectives. Data collected from the first item, indicated that 80% felt “prepared” to develop social and emotional competencies in children (e.g., empathy, motivation, self-regulation) Of these 51 respondents, 32.00% (n=16) rated themselves as “very well” prepared, 32.00% (n=16) felt “well prepared,” and 12.0% (n=6), marked themselves as “adequately” prepared. Data collected from the second item, showed that 76% felt “prepared” to develop students' critical thinking, problem solving and decision-making skills. Of these 51 respondents, 35.30% (n=18) rated themselves as “very well” prepared, 27.50% (n=14) felt “well prepared,” and 17.60% (n=9), marked themselves as “adequately” prepared.
It is somewhat concerning that, in 2017-2018, 38% of responders indicated that they were only adequately prepared to develop social and emotional competencies in children. However, the percentage declined significantly in 2018-2019, with only 12% indicating they were adequately prepared and 64% indicating they were well or very well prepared. Still, this is an area the program may want to examine further in the future.
Next Steps:
Overall, our analyses from the different datasets indicate our program completers
are fairly well prepared to support student’s growth in international and global perspectives.
After all, the way to develop an international and global perspective is to develop
a global and international mindset. This requires that candidates in our program be
prepared to teach students in their classrooms to be able to leverage all that they
know about culture and the cultures of others to react to situations in the most productive
ways. When taking a closer look at the data, our Year One Teachers compared to our
Employer partners show a considerable difference in results. For example, our employers
consistently evaluated our program completers as “well” prepared; whereas, our program
completers as First Year Teachers identified themselves as “adequately” prepared.
Is it possible that the graduates of our program do not see themselves as having been
prepared to recognize the effects of globalization in the lives of their students
and communities once they transition from student to teacher? However, has our program’s
candidates' international and global mindset changed over the years? Without the
data, the program can not be sure. But, if we look at the trends in our current society,
Critical Race Theory or borderless borders are academic disciplines that are just
permeating the California public school system, the answer would be that education
is the key to developing an internal and global mindset.
It is also apparent from the data sources used in this standard (2D) that there needs to be a more practical measure in place that captures our candidates ability to support international and global perspectives such as through the use of adolescent literature to transport students into different countries and cultures, or by helping our candidates to navigate situations where people of different cultures don’t always see eye-to-eye. Instead of shying away from controversial issues, our candidates need to be encouraged to engage in discussions that promote different points of view.
This can be easily brought into our classes; but specifically into their Teaching Second Language Learners In Secondary Classroom (LEE 157) course, whereby our program completers can be given an assignment with a rubric that would capture their ability to engage in intercultural communication and activities that would promote their own identities and the identities of their students through an international and global perspective. This idea can also be brought into student teaching by having our candidates can look at classroom management from a variety of cultural perspectives and figuring out ways to seek common ground. To evaluate our efforts in this area, the Single Subject Teacher Credential Program will need to collect criterion data from the course, student teaching, and triangulate it with our CCTC Program Completer Survey and CSU Educator Quality Center Survey results.