AAQEP Accreditation
Standard 2: Aspect E
Standard 2e: Program completers engage in professional practice in educational settings and show that they have the skills and abilities to do so in a variety of additional settings and community/cultural contexts. For example, candidates must have broad and general knowledge of the impact of culture and language on learning, yet they cannot, within the context of any given program, experience working with the entire diversity of student identities, or in all types of school environments.
Candidate preparation includes first-hand professional experience accompanied by reflection that prepares candidates to engage effectively in different contexts they may encounter throughout their careers.
Data Sources & Analysis
Data Source 1
CSU Educator Quality Center Year One Completer Survey
Description of Data Source:
The California State University’s Education Quality Center (EdQ) oversees the administration
of a survey of all individuals who completed a CSU teacher-preparation program after
their first year on the job. The survey is administered annually April through July.
In April, the EdQ Center emails an initial survey invitation to all completers of
Multiple Subject Credential Programs serving as first-year teachers in public schools,
charter schools, or private schools in all locations. Follow-up reminders are sent
every two weeks throughout the duration of the survey window.
In addition to asking questions about the completer’s demographics and educational background, the survey also contains items to capture data about the school where the completer is employed. Additionally, the survey includes items asking about candidates’ perceptions of various aspects of the preparation program and the field placement experience. Campuses have access to annual results from the survey by utilizing the EdQ Dashboard. Results can be disaggregated by various measures including campus, year of completion, respondent race/ethnicity, and type of credential. Note: the California Commission on Teacher Credentialing (CCTC) also distributes a Credential Program Completer Survey which gives an overall view of CA Educator Preparation Programs.
Perspective Captured from Data Source: Completer (one year after program completion)
Rationale for Using Data Source:
For candidates who completed a CSU educator preparation program each academic year
from 2014-2015 to 2017-2018, the CSU Educator Quality Center administered a year-out
survey to learn how well the educators, after their first year in the field, believed
the program had prepared them. Due to the challenges of educators in Spring 2020,
the CSU Educator Quality chose not to administer the survey at that time, meaning
data are not available for candidates who completed in 2018-2019. Survey administration
began again in Spring 2021, and we look forward to analyzing those data when they
become available.
Still, the routine, annual collection of these data offer the program to look at Multiple Subject Program Completer perceptions of preparedness longitudinally. Moreover, the survey items are also aligned to the Teaching Performance Expectations for which our program curriculum and clinical experiences are also aligned. This makes the survey a good tool for the face validity of the survey as it measures what our program intends to understand about the quality of our teacher credential program. Overall this survey tool aims to capture their perceptions of preparation after having been a teacher of record for one year.
We selected two (2) items from the survey that focused on the Multiple Subject Program Completers’ (MSPC) one-year out perspectives of how the program prepared them to take initiative in their use of formative assessment data to inform their reflective practice and professional growth.
Specific Elements of Data Source:
The items we selected to analyze include candidate responses for how well prepared
were you to begin each aspect of a teacher’s job listed below:
- To be reflective about my teaching and improve my practice so all students can learn.
- To use a variety of formative assessment methods to inform instructional practices.
Definition of Success for Each Element:
It is our program's goal to have 75% or more of candidates indicate positive preparedness
perceptions within the 3 - 5 range or from “Adequately Prepared” to “Well Prepared”
to “Very Well Prepared.”
Displays of Analyzed Data:
Figure 1: 2015-2016 Multiple Subject Program Completers One Year Out (N 44)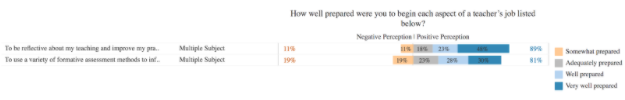
Figure 2: 2016-2017 Multiple Subject Program Completers One Year Out (N 61)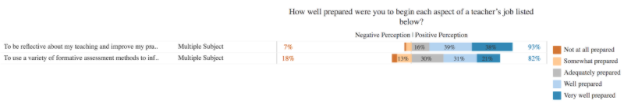
Figure 3: 2017-2018 Multiple Subject Program Completers One Year Out (N 59)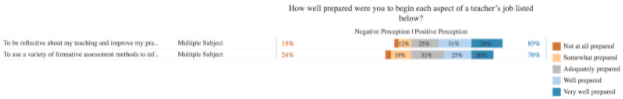
Link to Full Dataset: The link to the full dataset is unavailable. However, if reviewers would like to view the CSU Educator Quality Center Data Dashboards, we are happy to set up a time to provide them access by sharing screens in a Zoom session.
Interpretation of Data:
The data collected over these three years show a consistent trend that most of our
candidates feel well prepared with their ability to use data to inform their practice
as well as to engage in reflective practice. No items fell below 75% in positive perception
thereby meeting the program’s goal over the past three years. The slide back trend
did not occur as has been seen for the other CSU one-year out survey items as evidence
of Standard 2 Aspects b, c, and d. It is plausible that since the use of formative
assessments and reflective practice is central to the program’s teaching performance
assessment, Fresno Assessment of Student Teachers (FAST) that the program completers
felt more prepared in these areas during their first year of teaching.
Data Source 2
New Teacher Goals for Continuous Improvement
Description of Data Source:
Fresno Unified is the third largest school district in California, educating just
over 73,000 K-12 students in the 2019-2020 academic year (CDE, n.d.). Of those students, 68% identified as Latinx, 10% identified as Asian, 9% identified
as White, 8% identified as Black, and 2% identified with two or more races, and 60%
of those children are dual-language learners (CDE Dataquest, n.d.). Additionally, 85.9% of the students in the local school district receive free
or reduced meals (CDE, n.d.). Fresno Unified also consistently places the largest number of Multiple Subject
Credential Candidates with experience mentor teachers in their district for their
clinical experience (N 73; 26%). Moreover, Fresno Unified hires the majority of our MS program completers; 60-70
new hires each year. For these reasons, we launched a plan in March 2020 where Fresno
Unified agreed to strengthen their data collection systems so we could have opportunities
to receive their teacher induction program data.
Perspective Captured from Data Source: Completer New Teachers and District Instructional Coaches
Rationale for Using Data Source:
New teachers are introduced to and provided support in using new tools to help them
set goals to focus their continuous improvement efforts. This new teacher development
practice is part of the teacher evaluation process which is recognized as a desirable
method to achieve the improvement of instruction, to identify skills and abilities
that contribute to the success of the educational program, and to redirect skills
and abilities that do not result in optimum student growth. The goals of the evaluation
are as follows:
- To recognize the performance of outstanding employees
- To enhance and improve performance through communications that is direct, clear, honest, immediate, frequent, and evidence based
- To align professional growth to employees’ strengths and areas of improvement
- To provide avenues for informal and formal communications that build relationships.
District Instructional Coaches are trained to support new teachers in developing an evaluation plan where they set goals for continuous improvement during the first six weeks of the academic year. Overtime, the district instructional coaches introduce the new teachers to tools aimed at helping them improve their instructional practice. They log how often a new teacher uses various tools.
Specific Elements of Data Source:
We decided to gather information related to the frequency of tool implementation in
terms of the number of hours that new teachers work on using new tools to strengthen
their practice with their instructional coaches.
Definition of Success for Each Element:
It is our program's goal to have new teachers use tools more than 60 times to improve
their instruction during the academic year.
Displays of Analyzed Data:
Table 1: New Teacher Support Tools Used in 2020-2021
| Tools | Number of Tools Used Per New Teacher | Average Minutes Using High Leverage Tools Per New Teacher |
|---|---|---|
| Assessment of Student Learning Tools Used | 7 | 206 |
| Planning Tools Used | 10 | 706 |
| Observation and Feedback Tools | 17 | 683 |
Table 2: Frequency of Tools Used per Teacher in 2020-2021
| Total Average of Tools Used Entries per Teacher | 65 |
|---|
Link to Full Dataset: FUSD Fresno State Induction Data
Interpretation of Data:
The data collected over the past year suggests that the new teachers are frequently
engaging with tools to help them plan, assess, and reflect on their practice. On average
the district coaches logged that each new teacher used tools 65 times during the academic
year which meets our program goal.
Data Source 3
Fresno Assessment of Student Teachers II (FAST II): Teaching Sample Project
Description of Data Source:
The FAST is a Teaching Performance Assessment system designed specifically for use
in the teacher preparation program in the Kremen School of Education and Human Development
at California State University, Fresno. The FAST instrument assesses the pedagogical
competence of teacher candidates with regard to the Teaching Performance Expectations
(TPE’s). Although the FAST was originally developed and implemented about sixteen
years ago, it has recently been modified to align with the revised assessment standards
from California Commission on Teaching Credentialing (CCTC). Our Multiple Subject
Program was also being revised at the same time to align with the new Teaching Performance
Expectations. The revised assessment was piloted during the Fall 2017/Spring 2018
academic year and was approved by the California Department of Education in August
2018.
FAST II consists of two projects: the Site Visitation Project (SVP) is completed during initial student teaching (EHD 178) and the Teaching Sample Project (TSP) is completed during final student teaching (EHD 170). The Teaching Sample Project assesses teacher candidates’ ability to (a) identify the context of the classroom, (b) plan and teach a series of at least five cohesive lessons with a focus on content knowledge and literacy, (c) assess students’ learning related to the unit, (d) document their teaching and their students’ learning, and (e) reflect on the effectiveness of their teaching. Teacher candidates document how they are addressing the needs of all their students in the planning, teaching, and assessing of the content.
Perspective Captured from Data Source: Program Faculty and University Coaches
Rationale for Using Data Source:
The Teaching Sample Project (TSP) is one of two tasks in the Fresno Assessment of
Student Teachers (FAST) that collectively measure the pedagogical competence of teacher
candidates and interns for Preliminary Teaching Credentials in California, and serve
as information useful for determining program quality and effectiveness. Candidates
complete the TSP during the final phase of the program, measuring their abilities
at the end of our program just as they are entering the teaching profession. To complete
the TSP, candidates identify the classroom context (i.e. students and classroom environment),
plan and teach a series of at least 5 cohesive lessons (a unit of study) with a focus
on content knowledge and literacy, assess students’ learning before, during, and after
the unit, and reflect on the effectiveness of the instruction.
Specific Elements of Data Source:
The overall assignment is scored using a rubric. For the purposes of determining whether
or not our candidates exhibit knowledge of how to foster relationships with families/guardians/caregivers
in a variety of communities, we chose to focus on the rubric dimensions “Instructional
Decision Making” and “Reflection and Self-Evaluation.” In these sections, candidates
need to reflect-in-action to monitor and adjust instruction, as well as reflect-on-action,
to describe effective instruction and changes they would make for future instruction.
See Figures 4 and 5.
Figure 4: FAST: Teaching Sample Project Rubric, Instructional Decision-Making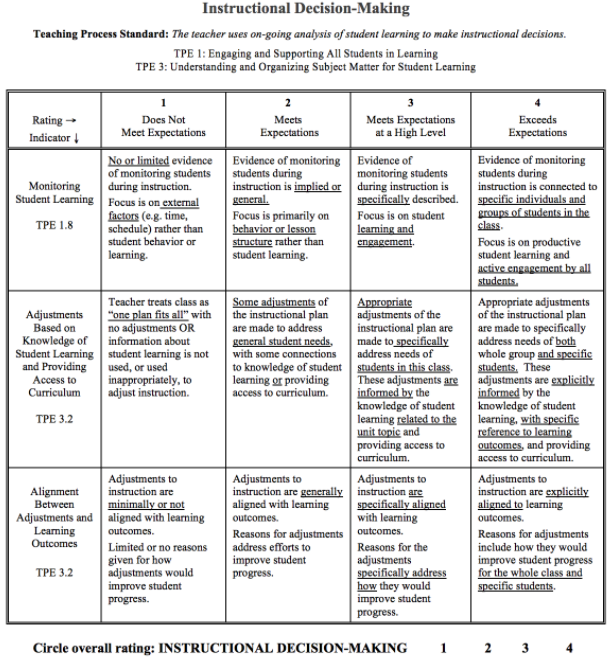
Figure 5: FAST: Teaching Sample Project Rubric, Reflection and Self-Evaluation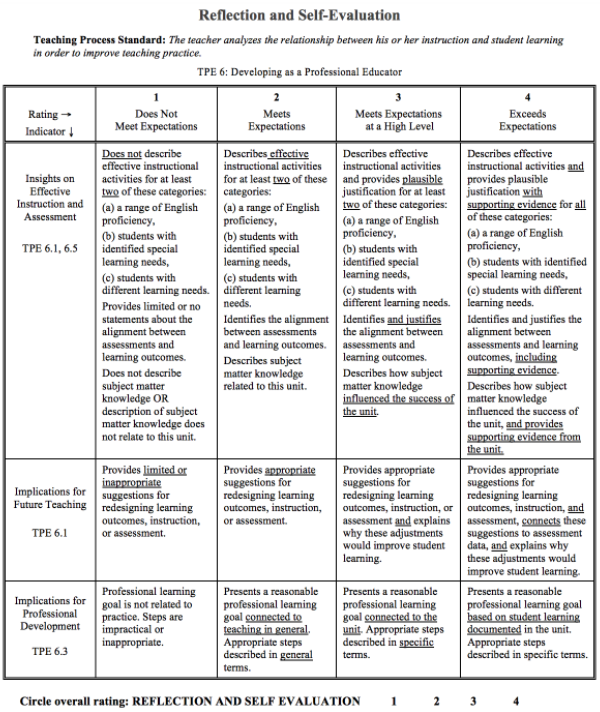
Definition of Success for Each Element:
Multiple Subject teacher candidates must score a 2 out of 4 on each of the rubrics
of the TSP in order to achieve a passing score. Our program goal is that our teacher
candidates score at least a 3 on each component of the TSP.
Displays of Analyzed Data:
Table 3: Teaching Sample Distribution of Scores for Instructional Decision-Making
| Semester | Score 1 | Score 2 | Score 3 | Score 4 | Average Score |
|---|---|---|---|---|---|
| Fall 2018 (n=94) |
4% | 41% | 50% | 5% | 2.5 |
| Spring 2019 (n = 98) |
1% | 47% | 47% | 5% | 2.5 |
| Fall 2019 (n = 129) |
0% | 35% | 62% | 3% | 2.6 |
| Spring 2020 (n = 52) |
2% | 43% | 52% | 3% | 2.5 |
Table 4: Teaching Sample Distribution of Scores for Reflection and Self-Evaluation
| Semester | Score 1 | Score 2 | Score 3 | Score 4 | Average Score |
|---|---|---|---|---|---|
| Fall 2018 (n=94) |
8% | 50% | 35% | 7% | 2.4 |
| Spring 2019 (n = 98) |
9% | 47% | 41% | 3% | 2.4 |
| Fall 2019 (n = 129) |
6% | 39% | 41% | 14% | 2.6 |
| Spring 2020 (n = 52) |
2% | 55% | 35% | 8% | 2.5 |
Link to Full Dataset: MS FAST Scores TSP
Interpretation of Data:
Data is presented for the Teaching Sample Project- Instructional Decision-Making and
Reflection and Self-Evaluation components for the previous four semesters. The data
illustrate that upon program completion candidates are highly effective at using reflection
to monitor student learning and make adjustments to their instruction. Consistently,
over 90% of candidates earn a passing score on these components of the TSP.
Next Steps:
Areas of Focus:
- Need to sustain program’s emphasis on inquiry and reflective practice.
- Need to address the program completers’ ability:
- To use a variety of formative assessment strategies to inform their instruction as measured by the Program Completer One Year Out Survey.
- Increase the percentage of candidates earning a 3 or higher on the TSP reflection and self-evaluation
In order to address what we found, we will . . .
- Invite program faculty and district partners into conversations about how we prepare program completers to be day one ready to establish goals and engage in reflection. Work together to reflect on… What does this look like in practice? How can we build in more clinical experiences that build new teacher confidence in these areas? What change ideas can we test out and study? Review data together and discuss what additional data is needed to help us develop interpretations that increase our confidence and decision-making.
To evaluate our efforts in this area, we will . . .
- Strengthen the datasets that we currently have to assess this area:
- Develop an Individual Development Plan (IDP) for Candidates during final student teaching that gathers information related to their specific goals for induction.
- Invite two more district partners to support data sharing of induction data including discussing their induction practices and data collection procedures.
- Learn more about Fresno Unified’s evaluation plan that is developed during week 6 and possibly seek ways to align it with the IDP data collection tool. Learn more about the tools used to set goals for continuous improvement and explore embedding some of them into our preparation program.