AAQEP Accreditation
Standard 2: Aspect A
Standard 2A: Program completers engage in professional practice in educational settings and show that they have the skills and abilities to do so in a variety of additional settings and community/cultural contexts. For example, candidates must have broad and general knowledge of the impact of culture and language on learning, yet they cannot, within the context of any given program, experience working with the entire diversity of student identities, or in all types of school environments.
Candidate preparation includes first-hand professional experience accompanied by reflection that prepares candidates to engage effectively in different contexts they may encounter throughout their careers.
Data Sources & Analysis
Data Source 1
CSU Educator Quality Center Employer Survey
Definition of Data Source:
The CSU Educator Quality Center administered a survey to employers of 2014-2015 and
2015-2016 graduates of CSU educator preparation programs. Results were able to be
disaggregated by both preparatory institution and program. The survey was discontinued
after evaluating the 2015-2016 completers, meaning that all available data are at
least five years old. The California Commission on Teacher Credentialing (CCTC) began
its own employer survey that it first administered in Fall 2019. However, while it
is possible to disaggregate results by institution, it is not possible to do so by
preparation program. In the future, we plan to advocate to the CCTC for the addition
of items to the survey that would allow data to be disaggregated in this way.
Although the data from the CSU Employer Survey are dated, we chose to use the results anyway as one of our three data sources because they do provide an employer perspective on our candidates. Additionally, the results provide us with a baseline to which we can compare results collected in the future.
Employers are invited to respond to each item on a 1-5 scale to indicate their perception of the completers’ level of preparation, with 1 indicating not at all prepared, 2 indicating poorly prepared; 3 indicating adequately prepared; 4 indicating well prepared and 5 indicating very well prepared.
Perspective Captured from Data Source: Employer
Specific Elements of Data Source:
CSU Educator Quality Center Employer Survey items selected include:
How well prepared was the teacher:
- To communicate and collaborate effectively with students' families, and
- To engage in culturally responsive teaching.
Definition of Success for Each Element:
Programmatically, our goal is that employers of our completers will indicate the teachers
were either “well,” or “very well” prepared in each area.
Displays of Analyzed Data
Figure 1. CSU Educator Quality Center Employer responses items related to 2014-2015 program
completers’ ability to support students’ growth in international and global perspectives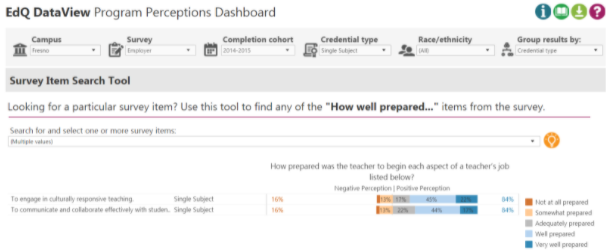
Figure 2. CSU Educator Quality Center Employer responses items related to 2015-2016 program
completers’ ability to support students’ growth in international and global perspectives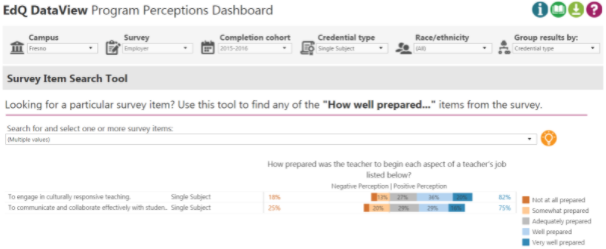
Link to Full Dataset: The link to the full dataset is unavailable. However, if reviewers would like to view the CSU Educator Quality Center Data Dashboards, we are happy to set up a time to provide them access by sharing screens in a Zoom session.
Interpretation of Data:
For the CSU Educator Quality Center survey evaluating the preparedness of completers
from the 2014-2015 cohort of candidates (Figure 1), 84% of responding employers indicated
an overall positive perception about how well prepared they felt our hired completers
were to “engage in culturally responsive teaching.” This included 21.90% (n=14) indicating they felt our candidates “very well prepared,”
45.30% (n=29) felt they were “well prepared,” and 17.20% (n=11) felt they were adequately
prepared. 84% of employers indicated an overall positive perception about how well
prepared their teachers were to “communicate and collaborate effectively with student families.” This included 17.5% (n=11) indicating they felt our completers were “very well prepared,”
44.40% (n=28) indicating our completers were “well prepared,” and 22.2% (n=14) indicating
that our completers were “adequately prepared.” Across both items, findings indicate
that the responding employers perceived our completers to be well prepared in these
areas.
Findings were similar from the 56 employers who responded to the employer survey evaluating 2015-2016 program completers (Figure 2). 75% of these school districts indicated an overall positive perception of how well prepared our completers were to “engage in culturally responsive teaching.” This included 19.60% (n=11) indicating they felt completers were “very well prepared,” 35.70% (n=20) indicating they were “well prepared,” and 26.80% (n=15) indicating they were adequately prepared. 82% of the employers also indicated an overall positive perception of how well prepared completers were to “communicate and collaborate effectively with student families.” This included 16.40% (n=9) indicating they felt completers were “very well prepared,” 29.10% (n=16) indicating completers were “well prepared,” and 29.10% (n=16) indicated that completers were “adequately prepared.” Across both items, these findings indicate the majority responding employers believe our candidates were well prepared in these areas.
Still, it is worth noting that, 25% of employers who responded to the survey indicated our 2015-2016 completers were not at all or only somewhat prepared to communicate and collaborate with student families. This is an area for us to investigate further as we begin to collect data on more recent completers.
Data Source 2
CCTC Program Completer Survey
Description of Data Source:
The California Commission on Teacher Credentialing administers a survey annually to
all individuals in the state when they apply for a credential. The survey seeks to
collect candidates’ perceptions of their preparation program and is organized under
the six domains of the Teaching Performance Expectations (TPEs).
CCTC Program Completers responded to each survey item on a 1-5 scale, with 1 indicating “not at all” prepared, 2 indicating “poorly” prepared; 3 indicating “adequately” prepared; 4 indicating “well” prepared, and 5 indicating “very well” prepared.
Perspective Captured from Data Source: Program Completer
Rationale for using Data Source:
Although the survey gathers data from candidates at the time they complete the program,
we believe that their perceptions of the program at this point help us to know if
they feel ready to engage with local school and cultural communities and communicate
effectively with families when they begin their careers.
Specific Elements of the Data Source:
CCTC Program Completer Survey items selected include:
How well did your preparation program prepare you to:
- Connect classroom learning to the real world
- Work with families to better understand students and to support their learning.
Definition of Success for Each Element:
Programmatically, our goal is for our candidates to say they were either “well,”
or “very well” prepared after completing the program.
Displays of Analyzed Data
Table 1. Responses to CCTC Completer Survey items related to creating positive learning
environments (Full Dataset)
| Rating | 2016-2017 (n=81) |
2017-2018 (n=188) |
2018-2019 (n=178) |
2019-2020 (n=165) |
|---|---|---|---|---|
| Connect classroom learning to the real world | ||||
| Not at all | 0 (0%) | 1 (0.5%) | 1 (0.6%) | 0 (0%) |
| Poorly | 3 (3.7%) | 9 (4.8%) | 7 (4.0%) | 6 (3.6%) |
| Adequately | 18 (22.2%) | 42 (22.3%) | 36 (20.3%) | 35 (21.2%) |
| Well | 25 (30.9%) | 56 (29.8%) | 61 (34.5%) | 58 (35.2%) |
| Very well | 35 (43.2%) | 80 (42.6%) | 72 (40.7%) | 66 (40.0%) |
| Work with families to better understand students and to support their learning. | ||||
| Not at all | 6 (7.6%) | 6 (3.2%) | 3 (1.7%) | 4 (2.4%) |
| Poorly | 6 (7.6%) | 16 (8.6%) | 23 (13.1%) | 12 (7.3%) |
| Adequately | 21 (26.6%) | 54 (29.2%) | 46 (26.3%) | 50 (30.5%) |
| Well | 27 (34.2%) | 52 (28.1%) | 52 (29.7%) | 50 (30.5%) |
| Very well | 19 (24.1%) | 57 (30.8%) | 51 (29.1%) | 48 (29.3%) |
Interpretation of Data:
As shown in Table 1, 95% of candidates who completed the program in 2017-2018 (n=188)
indicated they believed they were prepared to connect classroom learning to the real
world. Of these, 42.6% (n=80) rated themselves as “very well” prepared, 29.8% (n=56)
felt “well prepared,” and 22.3% (n=42) rated themselves as “adequately” prepared.
Responses to the second item showed that 88.10% believed they were “prepared” to work
with families to better understand students and to support their learning. Of these,
185 respondents, 30.8% (n=57) rated themselves as “very well” prepared, 28.10% (n=52)
rated themselves as “well prepared,” and 29.2% (n=54) rated themselves as “adequately”
prepared.
Of the 2018-2019 program completers (n=177), 95% indicated they were prepared to connect classroom learning to the real world. 40.7% (n=72) rated themselves as “very well” prepared, 34.5% (n=61) rated themselves as “well prepared,” and 20.3% (n=36) rated themselves as “adequately” prepared. Data collected from the second item showed that 84% felt prepared to work with families to better understand students and to support their learning. Of these 175 respondents, 29.1% (n=51) rated themselves as “very well” prepared, 29.7% (n=52) indicated they were “well prepared,” and 26.3% (n=46) rated themselves as “adequately” prepared.
We also report on the responses from the 2019-2020 program completers (n=165). Data collected from the first item indicated that 97.4% felt “prepared” to connect classroom learning to the real world. Of these 165 respondents, 40.0% (n=66) rated themselves as “very well” prepared, 35.2% (n=58) believed they were “well prepared,” and 21.2% (n=35), rated themselves as “adequately” prepared. Data collected from the second item showed that 90% of the responding program completers believed they were “prepared” to work with families to better understand students and to support their learning. Of these 164 respondents, 29.3% (n=48) rated themselves as “very well” prepared, 30.5% (n=50) believed they were “well prepared,” and 30.5% (n=50), rated themselves as “adequately” prepared.
Across all three years of data, findings show that the majority of program completers believed they were well-prepared to work with local school and cultural communities and with families from a variety of communities.
Data Source 3
CSU Educator Quality Center Year One Teacher Survey
Description of Data Source:
For candidates who completed a CSU educator preparation program each academic year
from 2014-2015 to 2017-2018, the CSU Educator Quality Center administered a year-out
survey to learn how well the educators, after their first year in the field, believed
the program had prepared them. Year One Teachers respond to each item on a 1-5 scale,
where 1 indicates they were not at all prepared, 2 indicates they were poorly prepared;
3 indicates they were adequately prepared; 4 indicates they were well prepared and
5 indicates they were very well prepared.
Due to the challenges of educators in Spring 2020, the CSU Educator Quality chose not to administer the survey at that time, meaning data are not available for candidates who completed in 2018-2019. Survey administration began again in Spring 2021, and we look forward to analyzing those data when they become available.
Perspective Captured from Data Source: Year One Teacher
Rationale for using Data Source:
The CSU Educator Quality Center survey captures the perspectives of program completers
after their first year of teaching. Items on the survey invite candidates to share
how well they believe the program prepared them in several key areas.
Specific Elements of Data Source:
Item selected from the Year One Teacher Survey include:
How well did the program prepare you:
- to adhere to appropriate state and federal policies of placement and instruction of EL’s;
- to understand the purpose, goals, and content of my school’s EL instructional program; and
- to communicate effectively with parents and families of EL’s.
Definition of Success for Each Element:
Programmatically, our goal is for all Year One teachers to indicate they were either
well or very well prepared in each area.
Displays of Analyzed Data
Figure 3. 2016-2017 Year One Teacher Survey Responses from 2015-2016 Completers for Program
Perception Items Related to Creating Productive Learning Environments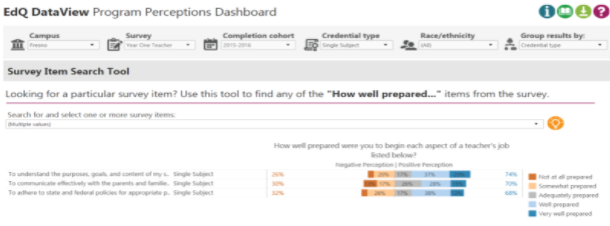
Figure 4. 2017-2018 Year One Teacher Survey Responses from 2016-2017 Completers for Program
Perception Items Related to Creating Productive Learning Environments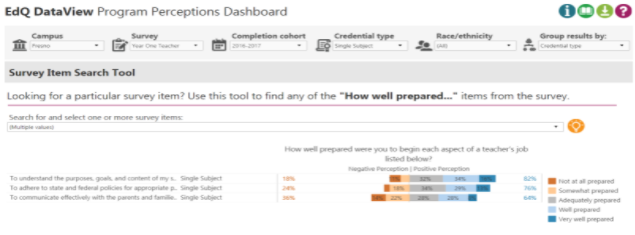
Figure 5. 2018-2019 Year One Teacher Survey Responses from 2017-2018 Completers for Program
Perception Items Related to Creating Productive Learning Environments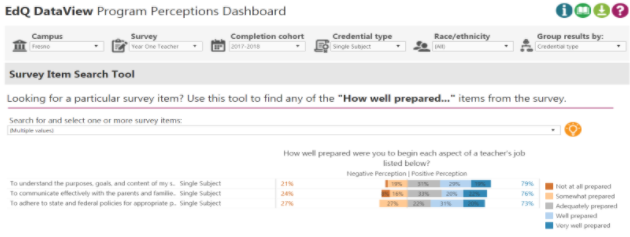
Link to Full Dataset: The link to the full dataset is unavailable. However, if reviewers would like to view the CSU Educator Quality Center Data Dashboards, we are happy to set up a time to provide them access by sharing screens in a Zoom session.
Interpretation of Data:
Data collected from 2015-2016 Educator Quality Center Year One Teacher surveys (Figure 3) indicated that 69% of responders believed they were prepared to adhere to appropriate
state and federal policies regarding the placement and instruction of EL’s. Of these,
54 respondents, 13.20% (n=7), rated themselves as “very well” prepared, 37.70% (n=20)
believed they were “well prepared,” and 17% (n=9) rated themselves as “adequately”
prepared. Additionally, 74% of responders indicated they believed they were “prepared”
to understand the purpose, goals, and content of their school’s EL instructional programs.
Of these 54 respondents, 15.10% (n=8) rated themselves as “very well” prepared, 28.30%
(n=15) believed they were “well prepared,” and 26.40% (n=14), rated themselves as
“adequately” prepared. In response to the item that asked year-one teachers how well
prepared they were to communicate effectively with parents and families of EL’s, 70%
indicated they felt “prepared.” Of these 54 respondents, 20.40% (n=11) rated themselves
as “very well” prepared, 37.00% (n=20) felt “well prepared,” and 16.70% (n=9), rated
themselves as “adequately” prepared.
Data collected from the 2016-2017 Educator Quality Center Year One Teacher surveys (n=38) (Figure 4), indicated that 76% felt “prepared” to adhere to appropriate state and federal policies of placement and instruction of EL’s. Of these 38 respondents, 13.20% (n=5) rated themselves as “very well” prepared, 28.90% (n=11) believed they were “well prepared,” and 34.20% (n=13) rated themselves as “adequately” prepared. Findings from the second item indicated that 64% of responders believed they were “prepared” to understand the purpose, goals, and content of their school’s EL instructional programs. Of these 38 respondents, 8.3% (n=3) rated themselves as “very well” prepared, 27.80% (n=10) felt “well prepared,” and 27.80% (n=10), marked themselves as “adequately” prepared. Finally, 82% of responders indicated they were “prepared” to communicate effectively with parents and families of EL’s. Of these, 15.80% (n=6) rated themselves as “very well” prepared, 34.20% (n=13) felt “well prepared,” and 31.60% (n=12), marked themselves as “adequately” prepared.
Responses collected from 2017-2018 program completers (n=49) after their first year of teaching (Figure 5) indicated that 76% believed they were “prepared” to adhere to appropriate state and federal policies of placement and instruction of EL’s. Of these, 20.40% (n=10) rated themselves as “very well” prepared, 30.60% (n=15) indicated they were “well prepared,” and 22.40% (n=11), rated themselves as “adequately” prepared. In response to the item that asked responders how prepared they were to understand the purpose, goals, and content of their school’s EL instructional programs, 64% indicated they believed they were “prepared”. Of the 49 respondents, 22.40% (n=11) rated themselves as “very well” prepared, 29.40% (n=10) indicated they were “well prepared,” and 32.70% (n=16) rated themselves as “adequately” prepared. Finally, 82% of the responders indicated they were “prepared” to communicate effectively with parents and families of EL’s. Of these respondents, 18.80% (n=9) rated themselves as “very well” prepared, 29.20% (n=14) indicated they were “well prepared,” and 31.30% (n=15), rated themselves as “adequately” prepared.
Findings from across all three items indicate that a large majority of year one teachers rated themselves as prepared to engage with local school and cultural communities and work with families from a variety of communities.
Next Steps:
Overall, findings indicate our program completers are prepared to engage with local
communities and foster relationships in a variety of communities. This evidenced very
specifically by the CCTC Program Completer Survey and the EdQ Year One Teacher Survey
and was further supported by the EdQ Employer Survey. However, even though the scores
are passable, the Year-One Teachers (EdQ Survey) reporting scores dropped by 15% the
following year after obtaining their preliminary credential. This drop may be an indication
that our candidates need to have more opportunities to gain confidence in their abilities
to communicate and foster relationships with families/guardians/caregivers in a variety
of cultural communities during the program.
In order to address what we found, we will need to build cultural community exposure in an effort to ensure that our candidates' experiences go beyond the first year of program completion. Moving forward, the program will work to incorporate assignments that invite our candidates to implement lessons that will increase their chances of working with school and community members.
To evaluate our efforts in this area, we will need to codify the candidates’ lesson plans and assignments regarding their experiences to understand and engage local school and cultural communities, and communicate and foster relationships with families in a variety of communities. This codification would necessitate the program faculty, the university coaches, and the advisors of the academic subject matter areas coming together to discuss this issue during our program meetings.
Finally, to learn more about employers’ perception of how well prepared our candidates are we will work to gather more specific data from them, either through revising the CCTC Employer Survey to allow for disaggregation by program, developing and administering our own unit-wide employer survey, or through holding focus group discussions with employers of our graduates.