AAQEP Accreditation
Standard 2 Aspect B
Standard 2: Program completers engage in professional practice in educational settings and show that they have the skills and abilities to do so in a variety of additional settings and community/cultural contexts. For example, candidates must have broad and general knowledge of the impact of culture and language on learning, yet they cannot, within the context of any given program, experience working with the entire diversity of student identities, or in all types of school environments.
Candidate preparation includes first-hand professional experience accompanied by reflection that prepares candidates to engage effectively in different contexts they may encounter throughout their careers.
Data Sources & Analysis
Data Source 1
Fresno Assessment of Student Teaching (FAST) - Teaching Sample Project (TSP)
Description of Data Source:
The Teaching Sample Project is one of two tasks in the Fresno Assessment of Student
Teachers (FAST) that collectively measure the pedagogical competence of teacher candidates
and interns for Preliminary Teaching Credentials in California, and as information
useful for determining program quality and effectiveness. To complete the TSP, candidates
are required: (a) to identify the context of their classroom (i.e. students and classroom
environment), (b) to plan and teach a series of at least five cohesive lessons (a
unit of study) with a focus on content knowledge and literacy, (c) to assess students’
learning before, during, and after the unit, (d) to document their teaching and their
students’ learning, and (e) reflect on the effectiveness of their teaching. The assessment
is scored using specific, task-focused rubrics. All coaches in the Ag Specialist program
are calibrated to score the assessment.
Perspective Captured from Data Source: University Coach
Rationale for Using Data Source:
In the Students in Context Section of the TSP, candidates are asked to:
- Collect data about students in your class to assist with planning instruction and assessment; describe the specific learning needs of three groups of students: (1) English language learners, (2) students with identified special needs, and (3) students with different instructional needs
- Identify how your instruction will meet their learning needs; and
- Develop a classroom management plan appropriate for your students and the classroom context.
As a program, we know that the majority of our candidates complete their field placements in classrooms where a majority of the students come from culturally and/or linguistically diverse backgrounds. For this reason, we believe the scores from this assessment help us to determine whether or not candidates are adequately prepared to engage in culturally responsive educational practices with diverse learners.
Specific Elements of Data Source:
Teaching Sample Project rubric for Students in Context Section
Overall score for Two Areas:
- Implications for Instruction (TPE 1.6, 4.1, 5.8)
- Creating and Maintaining Effective Environments (TPE 2.1, 2.3, 2.6)
Definition of Success for Each Element:
Programmatically, our goal is for all candidates to score at least a 2.0 (out of 4.0)
by their completion of their fieldwork experience
Displays of Analyzed Data:
Table 1. Statistical summaries of student rubric scores for TSP Section 3: Assessment
Plan
| Description | Spring 2019 | Fall 2019 | Spring 2020 |
|---|---|---|---|
| Number of candidates | 123 | 45 | 120 |
| Mean Rubric Score (Attempt 1) | 2.69 | 2.78 | 2.83 |
| Standard Deviation (Attempt 1) | 0.60 | 0.60 | 0.62 |
| Students Passing Attempt 1 | 122 | 45 | 120 |
| % Passing Attempt 1 | 99.19% | 100.00% | 100.00% |
Link to Full Dataset:
Interpretation of Data:
With regard to AAQEP Standard 2c as addressed in Table 1, we found that programmatically,
our candidates were rated as passing (i.e. achieving a rubric score of 2 or higher)
at a rate of 99.19% in Spring 2019, 100.00% in Fall 2019, and 100.00% in Spring 2020.
Overall, this suggests to us that in general, nearly all of our students are rated
as well-prepared to address issues of understanding students in context. We present
the passing rates for students across “first attempts” because not all students attempted
to take the FAST multiple times.
What these trends suggest to us is that in general, the program overall may be generally succeeding to prepare teacher-candidates to “engage in culturally responsive educational practices with diverse learners.” However, it is worth noting that that average scores do fall within the 2 range, though there is a slightly upward trend. As a program, this is an area where we can continue to focus our attention, with a goal of reaching an average score of 3.
Data Source 2
CCTC Program Completer Survey
Description of Data Sources:
The California Commission on Teacher Credentialing administers a survey annually to
all individuals in the state when they apply for a credential. The survey seeks to
collect candidates’ perceptions of their preparation program and is organized under
the six domains of the Teaching Performance Expectations (TPEs).
CCTC Program Completers responded to each survey item on a 1-5 scale, with 1 indicating “not at all” prepared, 2 indicating “poorly” prepared; 3 indicating “adequately” prepared; 4 indicating “well” prepared, and 5 indicating “very well” prepared.
Perspective Captured from Data Source: Program Completer
Rationale for using Data Source:
Although the survey gathers data from candidates at the time they complete the program,
we believe that their perceptions of the program at this point help us to know if
they feel ready to engage in culturally responsive educational practices with diverse
learners and do so in diverse cultural and socioeconomic community contexts when they
begin their careers.
Specific Elements of the Data Source:
CCTC Program Completer Survey items selected include:
How well did your preparation program prepare you to:
- Meet the instructional needs of English learners
- Plan instruction based on students' prior knowledge, academic readiness, language proficiency, cultural background, and individual development
Definition of Success for Each Element: Programmatically, our goal is for our candidates to indicate they were either well or very well prepared after completing the program.
Table 2. Responses to CCTC Completer Survey items related to creating positive learning environments (Full Dataset)
| Rating | 2016-2017 (n=80) |
2017-2018 (n=187) |
2018-2019 (n=178) |
2020 (n=165) |
|---|---|---|---|---|
| Meet the instructional needs of English learners | ||||
| Not at all | 1 (1.2%) | 1 (0.53%) | 0 (0.0%) | 1 (0.61%) |
| Poorly | 2 (2.5%) | 11 (5.9%) | 9 (5.1%) | 5 (3.1%) |
| Adequately | 11 (13.6%) | 43 (23.0%) | 53 (29.8%) | 40 (24.5%) |
| Well | 26 (32.1%) | 69 (36.9%) | 58 (32.6%) | 69 (42.3%) |
| Very well | 41 (50.6%) | 63 (33.7%) | 58 (32.6%) | 48 (29.4%) |
| Plan instruction based on students' prior knowledge, academic readiness, language proficiency, cultural background, and individual development | ||||
| Not at all | 0 (0%) | 2 (1.1%) | 0 (0%) | 1 (0.60%) |
| Poorly | 5 (6.3%) | 8 (4.3%) | 9 (5.1%) | 6 (3.6%) |
| Adequately | 16 (20%) | 44 (23.5%) | 37 (20.8%) | 34 (20.6%) |
| Well | 30 (37.5%) | 58 (31.0%) | 66 (37.1%) | 60 (36.4%) |
| Very well | 29 (36.3%) | 75 (40.1%) | 66 (37.1%) | 64 (38.8%) |
Interpretation:
Examining the responses to the two responses selected to evaluate completers’ perception
of how well prepared they were to engage in culturally responsive educational practices
with diverse learners reveals that, overall, completers did believe they were prepared.
Across both items, at least two-thirds of responding completers each year indicated
they were well or very well prepared to meet the instructional needs of English Learners
and plan instruction based on students’ prior knowledge, academic readiness, language
proficiency, cultural background, and individual development.
However, it is somewhat concerning that nearly 30% of completers in 2018-2019 and nearly 25% in 2019-2020 indicated they were only adequately prepared to meet the instructional needs of English learners, especially given the high number of English learners in our region. This is definitely an area the program needs to investigate further.
Data Source 3
CSU Educator Quality Center Year One Teacher Survey
Description of Data Source:
For candidates who completed a CSU educator preparation program each academic year
from 2014-2015 to 2017-2018, the CSU Educator Quality Center administered a year-out
survey to learn how well the educators, after their first year in the field, believed
the program had prepared them. Year One Teachers respond to each item on a 1-5 scale,
where 1 indicates they were not at all prepared, 2 indicates they were poorly prepared;
3 indicates they were adequately prepared; 4 indicates they were well prepared and
5 indicates they were very well prepared.
Due to the challenges of educators in Spring 2020, the CSU Educator Quality chose not to administer the survey at that time, meaning data are not available for candidates who completed in 2018-2019. Survey administration began again in Spring 2021, and we look forward to analyzing those data when they become available.
Perspective Captured from Data Source: Year One Teacher
Rationale for using Data Source:
The CSU Educator Quality Center survey captures the perspectives of program completers
after their first year of teaching. Items on the survey invite candidates to share
how well they believe the program prepared them in several key areas.
Specific Elements of Data Source:
Items selected for analysis of how well completers believe they were prepared to engage
in culturally responsive educational practices with diverse learners and do so in
diverse cultural and socioeconomic community contexts include:
How well prepared were you:
- to meet the instructional needs of English learners
- To meet the instructional needs of students from diverse cultural backgrounds
- To teach ELs by building on their abilities, cultural and linguistic backgrounds, and community resources
- To organize and manage a classroom that includes first- and second-language learners
Definition of Success for Each Element:
Programmatically, our goal is for 80% of Year One teachers to indicate they were either
well or very well prepared in each area.
Displays of Analyzed Data:
Figure 1. 2016-2017 Year One Teacher Survey Responses from 2015-2016 Completers (n=57) for
Program Perception Items Related to Creating Productive Learning Environments 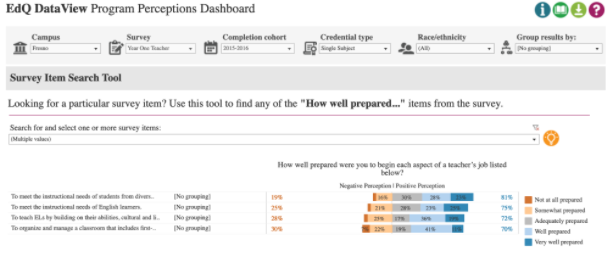
Figure 2. 2017-2018 Year One Teacher Survey Responses from 2016-2017 Completers (n=38) for
Program Perception Items Related to Creating Productive Learning Environments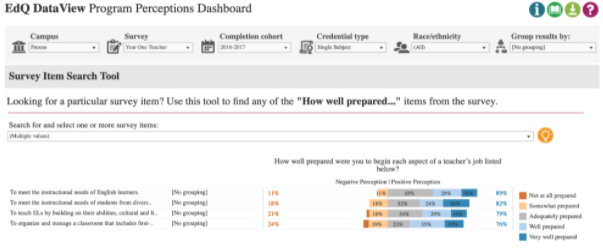
Figure 3. 2018-2019 Year One Teacher Survey Responses from 2017-2018 (n=51) Completers for
Program Perception Items Related to Creating Productive Learning Environments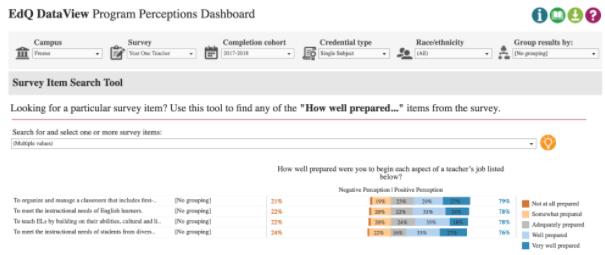
Link to Full Dataset: The link to the full dataset is unavailable. However, if reviewers would like to view the CSU Educator Quality Center Data Dashboards, we are happy to set up a time to provide them access by sharing screens in a Zoom session.
Interpretation of Data:
Looking across the three years of responses related to engaging in culturally responsive
educational practices with diverse learners from teachers one year after they completed
our program shows that, overall, completers believed they were at least adequately
prepared in each area. In the final two years data were collected, at least 75% of
responders indicated they were at least adequately prepared.
However, the number of individuals who indicated they were just adequately prepared is somewhat concerning, though the percentages of responders who selected this option did decline from 2017 to 2018. Still, in 2018, 24% of responders indicated they were only adequately prepared to teach ELs by building on their abilities, cultural and linguistic backgrounds, and community resources. Additionally, in 2018, 22% of responders indicated they were only somewhat prepared or not at all prepared in this area. Given the program’s focus on culturally sustaining pedagogy, we would have anticipated a greater percentage of responders to indicate they were well or very well prepared.
Next Steps:
Looking across the three data sources used to evaluate how well program completers
are able to engage in culturally responsive educational practices with diverse learners
in diverse cultural and socioeconomic community contexts, we see that, overall, the
program is preparing them to do so. Both candidates’ scores on the Teaching Sample
Project portion of the FAST and the survey responses of completers demonstrate this,
though both sets of data also indicate there is room for improvement. The same holds
true when examining the survey responses of program completers after their first year
of teaching.
In particular, both sets of survey results highlight some potential weaknesses in how well the program prepares candidates to plan instruction to support their English Learners by building on their cultural and linguistic backgrounds and community resources. This finding is particularly troubling given the program-wide focus on culturally sustaining pedagogy and the large number of students in our region who are from culturally and/or linguistically diverse backgrounds. Additionally, candidates in the program do take a course specifically focused on teaching English Learners in secondary classrooms.
It is worth remembering that the survey data are a few years old, so a next step for the program is to gain the perspective of more recent graduates, first through a survey and then through follow-up focus groups to see if their perceptions align with those highlighted here. If the more recent completers’ perceptions do, in fact, align, the program will need to examine the content of the Teaching English Learners in Secondary Classrooms courses, in addition to the way culturally sustaining pedagogy is addressed throughout the curriculum. Potentially, the program may need to revise course syllabi in order to ensure that candidates are better prepared.