AAQEP Accreditation
Standard 2 Aspect C
Standard 2: Program completers engage in professional practice in educational settings and show that they have the skills and abilities to do so in a variety of additional settings and community/cultural contexts. For example, candidates must have broad and general knowledge of the impact of culture and language on learning, yet they cannot, within the context of any given program, experience working with the entire diversity of student identities, or in all types of school environments.
Candidate preparation includes first-hand professional experience accompanied by reflection that prepares candidates to engage effectively in different contexts they may encounter throughout their careers.
Data Sources & Analysis
Data Source 1
CSU Educator Quality Center Employer Survey
Definition of Data Source:
The CSU Educator Quality Center administered a survey to employers of 2014-2015 and
2015-2016 graduates of CSU educator preparation programs. Results were able to be
disaggregated by both preparatory institution and program. The survey was discontinued
after evaluating the 2015-2016 completers, meaning that all available data are at
least five years old. The California Commission on Teacher Credentialing (CCTC) began
its own employer survey that it first administered in Fall 2019. However, while it
is possible to disaggregate results by institution, it is not possible to do so by
preparation program. In the future, we plan to advocate to the CCTC for the addition
of items to the survey that would allow data to be disaggregated in this way.
Although the data from the CSU Employer Survey are dated, we chose to use the results anyway as one of our three data sources because they do provide an employer perspective on our candidates. Additionally, the results provide us with a baseline to which we can compare results collected in the future.
Employers are invited to respond to each item on a 1-5 scale to indicate their perception of the completers’ level of preparation, with 1 indicating not at all prepared, 2 indicating poorly prepared; 3 indicating adequately prepared; 4 indicating well prepared and 5 indicating very well prepared.
Perspective Captured from Data Source: Employer
Specific Elements of Data Source:
CSU Educator Quality Center Employer Survey items selected include:
How well prepared was the teacher:
- To promote student engagement by building upon students’ interests, strengths, and prior experiences.
- To establish a climate that promotes fairness and respect for all students
- To establish and maintain high expectations for learning.
Definition of Success for Each Element: Programmatically, our goal is that employers of our completers will indicate the teachers were either “well,” or “very well” in each area.
Displays of Analyzed Data
Figure 1. CSU Educator Quality Center Employer responses items related to 2014-2015 program
completers’ ability to support students’ growth in international and global perspectives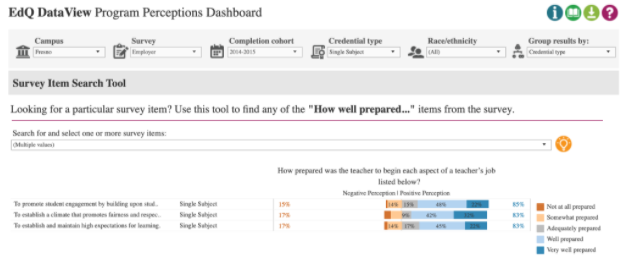
Figure 2. CSU Educator Quality Center Employer responses items related to 2015-2016 program
completers’ ability to support students’ growth in international and global perspectives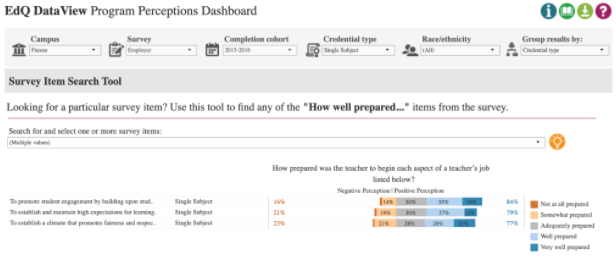
Links to Full Dataset:
The link to the full dataset is unavailable. However, if reviewers would like to view the CSU Educator Quality Center Data Dashboards, we are happy to set up a time to provide them access by sharing screens in a Zoom session.
Interpretation of Data:
For the CSU Educator Quality Center survey evaluating the preparedness of completers
from the 2014-2015 cohort of candidates (Figure 1), 85% of the 65 responding employers
indicated an overall positive perception about how well prepared they felt our completers
were “To promote student engagement by building upon students’ interests, strengths,
and prior experiences.” This included 21.5% (n=14) indicating they believed our completers
were “very well prepared,” 47.7% (n=31) indicating our completers were “well prepared,”
and 15.4% (n=10) indicating our completers were “adequately prepared.” 83% of respondents
indicated an overall positive perception that completers were prepared “To establish
a climate that promotes fairness and respect for all students.” This included 32.3%
(n=21) indicating they felt their hired completers “very well prepared,” 41.5% (n=27)
indicating “well prepared,” and 9.2% (n=6) indicating adequately prepared. Lastly,
83% of the employers indicated an overall positive perception that completers were
prepared “To establish and maintain high expectations for learning.” This included
21.5% (n=14) indicating completers were “very well prepared,” 44.6% (n=29) indicating
completers were “well prepared,” and 16.9% (n=11) indicating our completers were “adequately
prepared.”
Findings were similar from the 57 employers who responded to the employer survey evaluating 2015-2016 program completers (Figure 2). Of these, 84% indicated an overall positive perception of how well prepared they felt our completers were “To promote student engagement by building upon students’ interests, strengths, and prior experiences.” This included 19.3% (n=11) indicating they believed our completers were “very well prepared,” 35.1% (n=20) indicating our completers were “well prepared,” and 29.8% (n=17) indicating our completers were “adequately prepared.” 79% of respondents indicated an overall positive perception of how well prepared they believed completers were “To establish and maintain high expectations for learning.” This included 12.3% (n=7) indicating our completers were “very well prepared,” 36.8% (n=21) indicating our completers were “well prepared,” and 29.8% (n=17) indicating our completers were “adequately prepared.” Lastly, 77% of respondents indicated an overall positive perception that our completers were well prepared “To establish a climate that promotes fairness and respect for all students.” This included 21.1% (n=12) indicating our completers were “very well prepared,” 28.1% (n=16) indicating our completers were “well prepared,” and 28.1% (n=16) indicating our completers were “adequately prepared.”
Data Source 2
CCTC Program Completer Survey
Description of Data Source:
The California Commission on Teacher Credentialing administers a survey annually to
all individuals in the state when they apply for a credential. The survey seeks to
collect candidates’ perceptions of their preparation program and is organized under
the six domains of the Teaching Performance Expectations (TPEs).
CCTC Program Completers responded to each survey item on a 1-5 scale, with 1 indicating “not at all” prepared, ” 2 indicating “poorly” prepared; 3 indicating “adequately” prepared; 4 indicating “well” prepared, and 5 indicating “very well” prepared.
Perspective Captured from Data Source: Program Completer
Rationale for using Data Source:
Although the survey gathers data from candidates at the time they complete the program,
we believe that their perceptions of the program at this point help us to know if
they feel ready to Create productive learning environments, and use strategies to
develop productive learning environments in a variety of school contexts when they
begin their careers.
Specific Elements of the Data Source:
CCTC Program Completer Survey items selected include:
How well did your preparation program prepare you to:
- Engage students in cooperative group work as well as independent learning
- Establish and maintain a safe and respectful learning environment for all students
- Create a productive learning environment with high expectations for all students
Definition of Success for Each Element: Programmatically, our goal is for our candidates to indicate they were either well or very well prepared after completing the program.
Table 1. Responses to CCTC Completer Survey items related to creating positive learning environments (Full Dataset)
| Rating | 2016-2017 (n=81) |
2017-2018 (n=188) |
2018-2019 (n=178) |
2019-2020 (n=165) |
|---|---|---|---|---|
| Engage students in cooperative group work as well as independent learning | ||||
| Not at all | 0 (0%) | 1 (0.5%) | 0 (0%) | 0 (0%) |
| Poorly | 0 (0%) | 4 (2.1%) | 6 (3.3%) | 6 (3.7%) |
| Adequately | 9 (17.6%) | 43 (23%) | 40 (22.5%) | 34 (20.7%) |
| Well | 16 (31.4%) | 66 (35.2%) | 62 (34.8%) | 57 (34.8%) |
| Very well | 26 (51%) | 73 (39%) | 70 (39.3%) | 67 (40.9%) |
| Establish and maintain a safe and respectful learning environment for all students | ||||
| Not at all | 0 (0%) | 3 (1.6%) | 0 (0%) | 1 (0.6%) |
| Poorly | 1 (1.2%) | 4 (2.1%) | 4 (2.2%) | 3 (1.8%) |
| Adequately | 15 (18.5%) | 43 (22.9%) | 32 (18.0%) | 25 (15.2%) |
| Well | 26 (32.1%) | 54 (28.7%) | 61 (34.3%) | 52 (31.5%) |
| Very well | 39 (48.1%) | 84 (44.7%) | 81 (45.5%) | 84 (50.9%) |
| Create a productive learning environment with high expectations for all students | ||||
| Not at all | 0 (0%) | 3 (1.6%) | 0 (0%) | 0 (0%) |
| Poorly | 2 (2.5%) | 6 (3.2%) | 7 (3.9%) | 5 (3.0%) |
| Adequately | 14 (17.3%) | 41 (21.8%) | 35 (19.7%) | 32 (19.4%) |
| Well | 26 (32.1%) | 61 (32.4%) | 59 (33.1%) | 63 (38.2%) |
| Very well | 39 (48.1%) | 77 (41.0%) | 77 (43.3%) | 65 (39.4%) |
Interpretation:
As highlighted above, programmatically, our goal was for all completers to indicate
they were either well or very well prepared in each area. While the majority of completers
did indicate this was the case, on average, around 20% of completers each year responded
to each item that they were only adequately prepared. The percentages of responses
marked as adequately prepared were highest for the item that asked about completers’
preparation to engage students in cooperative group work as well as independent learning.
This is an instructional area the program may need to examine further to ensure that
all completers feel prepared to group students in different ways for instructional
purposes.
Data Source 3
CSU Educator Quality Center Year One Teacher Survey
Description of Data Source:
For candidates who completed a CSU educator preparation program each academic year
from 2014-2015 to 2017-2018, the CSU Educator Quality Center administered a year-out
survey to learn how well the educators, after their first year in the field, believed
the program had prepared them. Year One Teachers respond to each item on a 1-5 scale,
where 1 indicates they were not at all prepared, 2 indicates they were poorly prepared;
3 indicates they were adequately prepared; 4 indicates they were well prepared and
5 indicates they were very well prepared.
Due to the challenges of educators in Spring 2020, the CSU Educator Quality chose not to administer the survey at that time, meaning data are not available for candidates who completed in 2018-2019. Survey administration began again in Spring 2021, and we look forward to analyzing those data when they become available.
Perspective Captured from Data Source: Year One Teacher
Rationale for using Data Source:
The CSU Educator Quality Center survey captures the perspectives of program completers
after their first year of teaching. Items on the survey invite candidates to share
how well they believe the program prepared them in several key areas.
Specific Elements of Data Source:
Items selected for analysis include:
How well prepared were you:
- to help students use digital media and environments to communicate and work collaboratively
- to understand and support students whose learning is affected by difficult circumstances in their lives
- to handle a range of classroom management and discipline situations
Definition of Success for Each Element:
Programmatically, our goal is for all Year One teachers to indicate they were either
well or very well prepared in each area.
Figure 3. 2016-2017 Year One Teacher Survey Responses from 2015-2016 Completers for Program
Perception Items Related to Creating Productive Learning Environments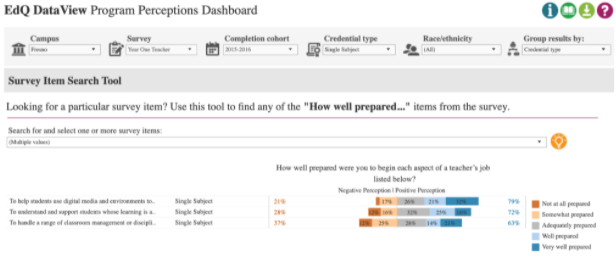
Figure 4. 2017-2018 Year One Teacher Survey Responses from 2016-2017 Completers for Program
Perception Items Related to Creating Productive Learning Environments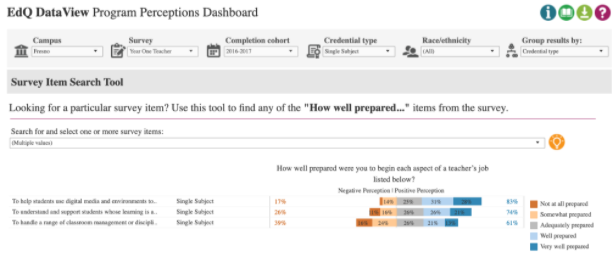
Figure 5. 2018-2019 Year One Teacher Survey Responses from 2017-2018 Completers for Program
Perception Items Related to Creating Productive Learning Environments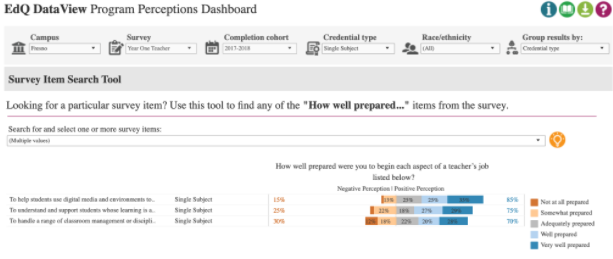
Link to Full Dataset:
The link to the full dataset is unavailable. However, if reviewers would like to view the CSU Educator Quality Center Data Dashboards, we are happy to set up a time to provide them access by sharing screens in a Zoom session.
Interpretation of Data:
Looking across the responses from the three years indicates that, overall, program
completers believe they were prepared in each of the three areas measured: their ability
to help students use digital media and environments to communicate and work collaboratively,
and to understand and support students whose learning is affected by difficult circumstances
in their lives, and to handle a range of classroom management and discipline situations.
However, looking more carefully at the responses reveals that, in the second two areas,
less than half of the responding completers indicated they were well or very well-prepared.
The only exception to this was in 2018-2019, when 56% of completers from 2017-2018
indicated they were well or very well prepared to understand and support students
whose learning is affected by difficult circumstances in their lives.
What is perhaps most striking is that nearly one-third of completers consistently indicated that they were somewhat or not at all prepared to handle a range of classroom management and discipline situations, though the percentage of responders who indicated this did decline from year to year. This is clearly an area the program needs to examine further.
Next Steps:
Looking across all three data sources considered for Standard 2c, we noted some particular
areas of improvement. With regard to Data Source 1 (Employer’s Program Perception
Surveys), while we did note generally positive perceptions for the three survey items
analyzed, we would like to see our program’s efficacy improve to reflect higher rates
(i.e. 90% or above) of satisfaction from employers in each of these areas. Results
from Data Source 2, the CCTC Completer survey, indicated that, while overall the percentage
of responders who indicated they were prepared to engage students in cooperative group
work as well as independent learning was high, many of those who responded indicated
they were only adequately prepared. Data Source 3 (Year-One Teacher Survey) revealed
additional areas of growth, particular in the area of classroom management, which
suggested 61-70% generally positive perceptions (we would like to see our program
improve these to 80% or higher).
In order to address what we found, we will discuss the possibility of developing a course focused specifically on developing positive and productive learning environments, attending in particular to issues of classroom culture, supporting students through difficult circumstances, and addressing issues of equity in schooling. Alternatively, we could turn our attention to integrating a focus on developing positive and productive learning environments into multiple courses. Additionally, we will develop a mechanism for reaching out to employers and first-year teachers who have completed our program to understand the rationale behind their survey responses and how we can incorporate their experiences into our credential program experience.
To evaluate our efforts in this area, we will continue collecting and analyzing employer / first year teacher survey data on an annual basis, layering on qualitative data as our process is solidified over time. We will seek to develop tighter alignment across items on the Employer, Completer, and First-Year Teacher surveys so that the data sources will be more comparable in the future. Finally, as a methodological improvement to this process, we will commit to developing a more robust survey collection system for district employers to ensure continuity in our ability to evaluate program effectiveness moving forward.